Diagnosing and resolving performance issues helps your organization attract new users while retaining existing ones. According to Google's research, 29% of mobile users will avoid using a site or an application if it's too slow or too difficult to find information. Of that 29% of users, 70% leave because of site latency. While core web vitals capture how assets behave on your page from a user perspective, they're one part of resolving poor app performance.
Objectives
This tutorial walks you through using New Relic to fix site latency. You'll complete these tasks:
- Understand different types of latency and how your customers experience them.
- Take preventative measures ahead of high latency.
- Use New Relic to diagnose causes of latency.
Diagnose latency issues
Latency measures how quickly a user receives a response when they make a request. Latency manifests through different page behaviors, so understanding the nuances between these behaviors can help you diagnose the cause and improve your site more efficiently.
These are the most common causes of high latency:
Once you understand what causes latency, you can use the Summary and AJAX pages in to start your root cause analysis. In general, we make the following recommendations to optimize your site:
- Use a content delivery network (CDN). CDNs can adjust where content is being served from, or distribute them across different servers.
- Optimize above-the-fold content.
- Evaluate your web hosting service.
- Minimize JavaScript execution time.
- Use a caching plugin.
Diagnose high latency
Let's take a look at a service that is having issues with latency.

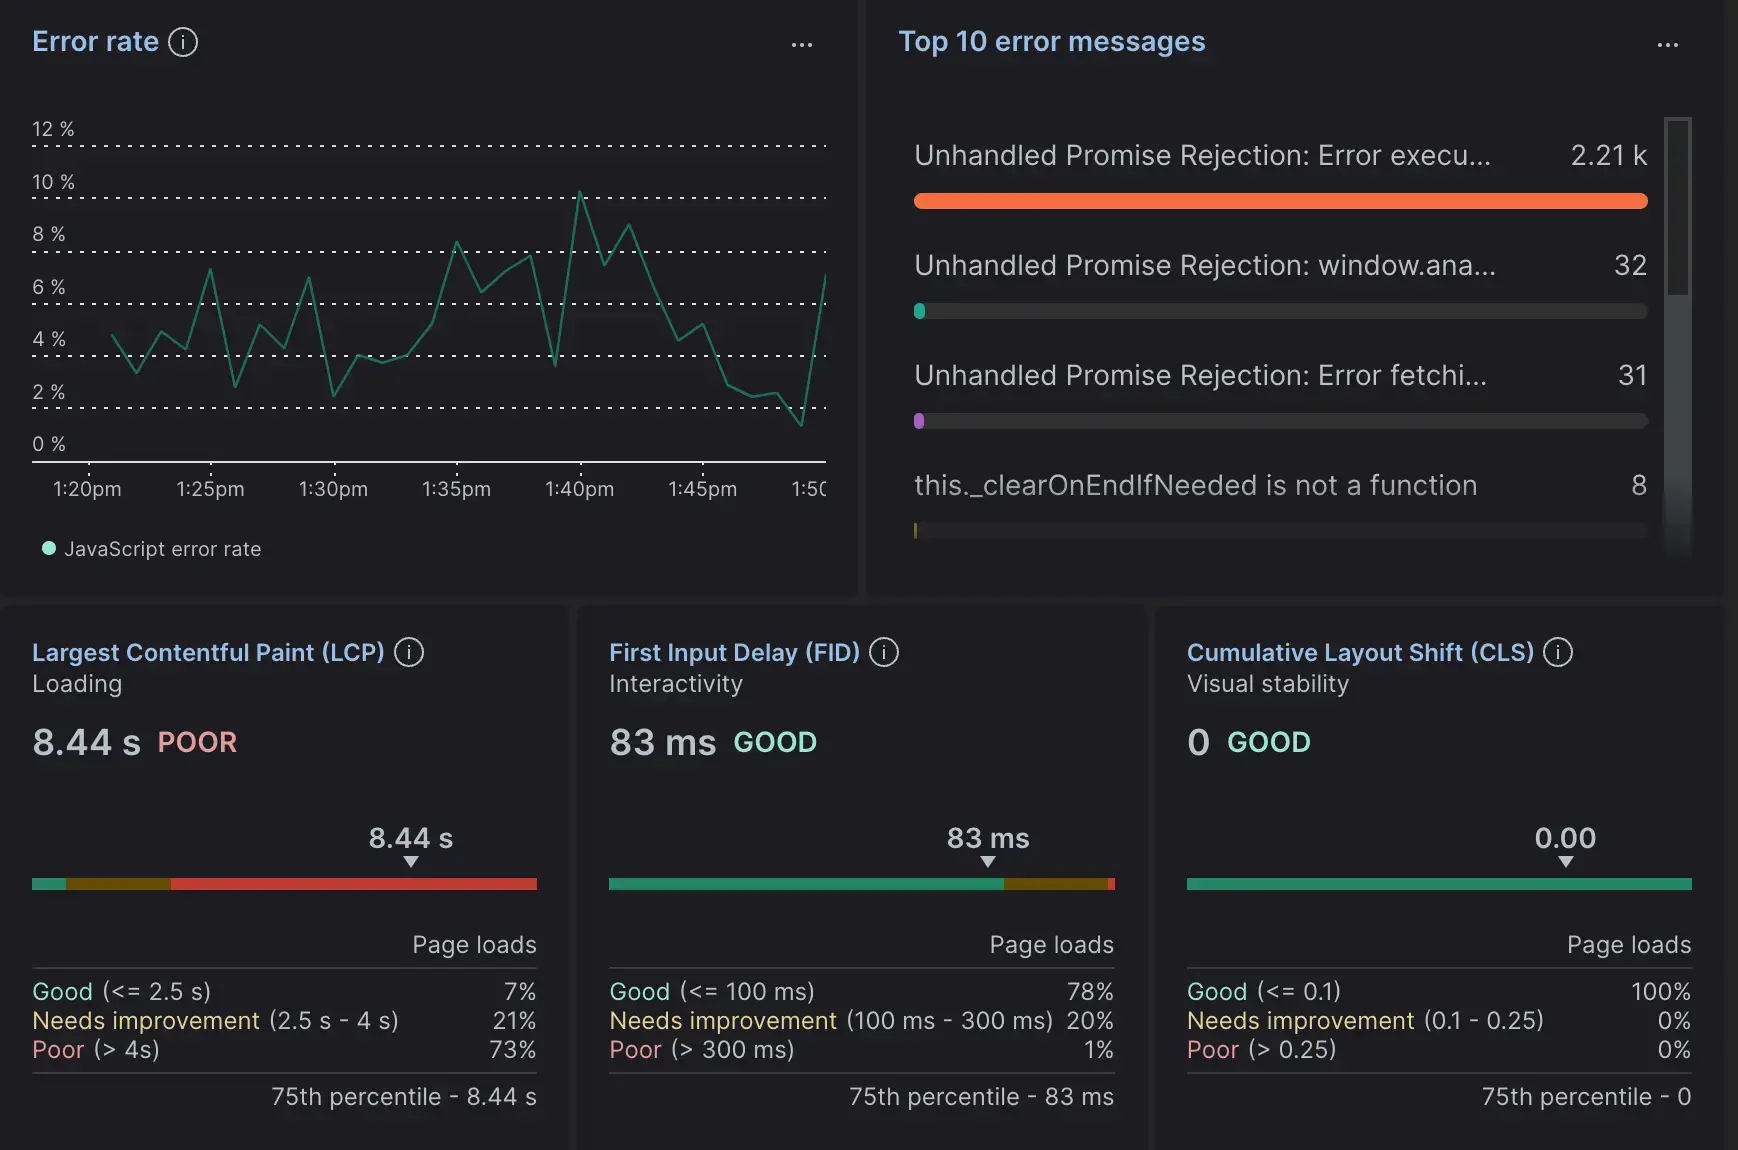
From the browser Summary page, you notice a service showing a Largest Contentful Paint of 8.44 seconds. Since everything else falls under acceptable parameters, you can narrow down the cause of your latency as slow page load.
- Select Session trace page to see a timeline of load and interaction events. This view takes a granular look at an individual session's activity, including page load timing, user interactions, AJAX requests, and errors during a session.
- Click the Largest Contentful Paint link to go to the Web vitals page. This gives you a more generalized overview of errors based on page URLs, device type, browser type, and more.
Looking into a latency issue from different points of view gives you more accuracy when it's time to plan a resolution. Once you've decided the best course of action, you can get your site back to the levels that keep your customers happy.