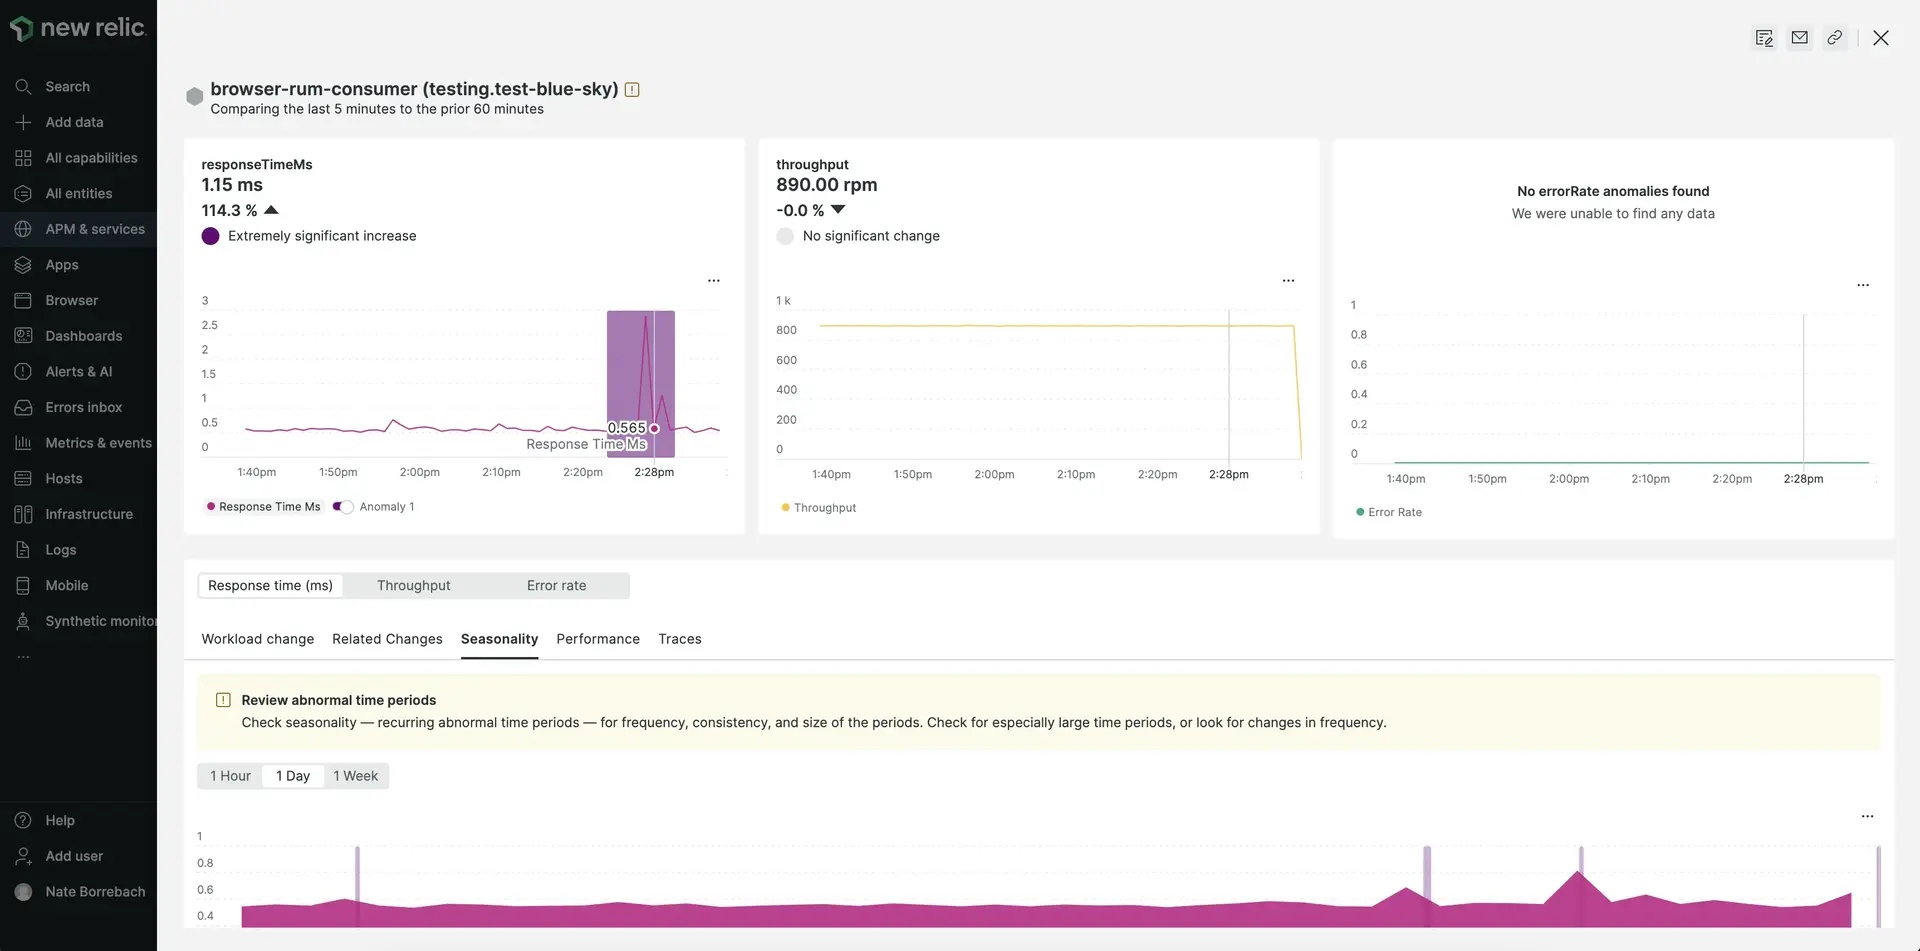
Use New Relic Lookout to detect deviations in your APM service entities' three golden signals (response time, error rate, and throughput) and analyze the behavior and causes of those deviations.
How does it work?
On the APM summary page, Lookout compares the values of golden signals within the past five minutes against its values over the preceding hour. If Lookout detects a signifigant upward or downard trend in the signal, a Diagnose button appears on the corresponding APM summary chat.

The Lookout Diagnose button embedded in an APM web transactions time chart
When clicked, the button opens a diagnostic Lookout tool which you can use to explore details about your golden signals.

The Lookout diagnosis nerdlet launched from APM