Once you've connected your applications to New Relic and have started exploring our charts and dashboards, a good next step is to create an alert to keep your team updated about any unusual behavior in your data. The capability elevate your New Relic experience from simply ingesting data to taking thoughtful and effective action.
Here, we'll walk you through the five steps of creating your first alert so you can start learning New Relic's alerting features.
Create your alert condition from a chart
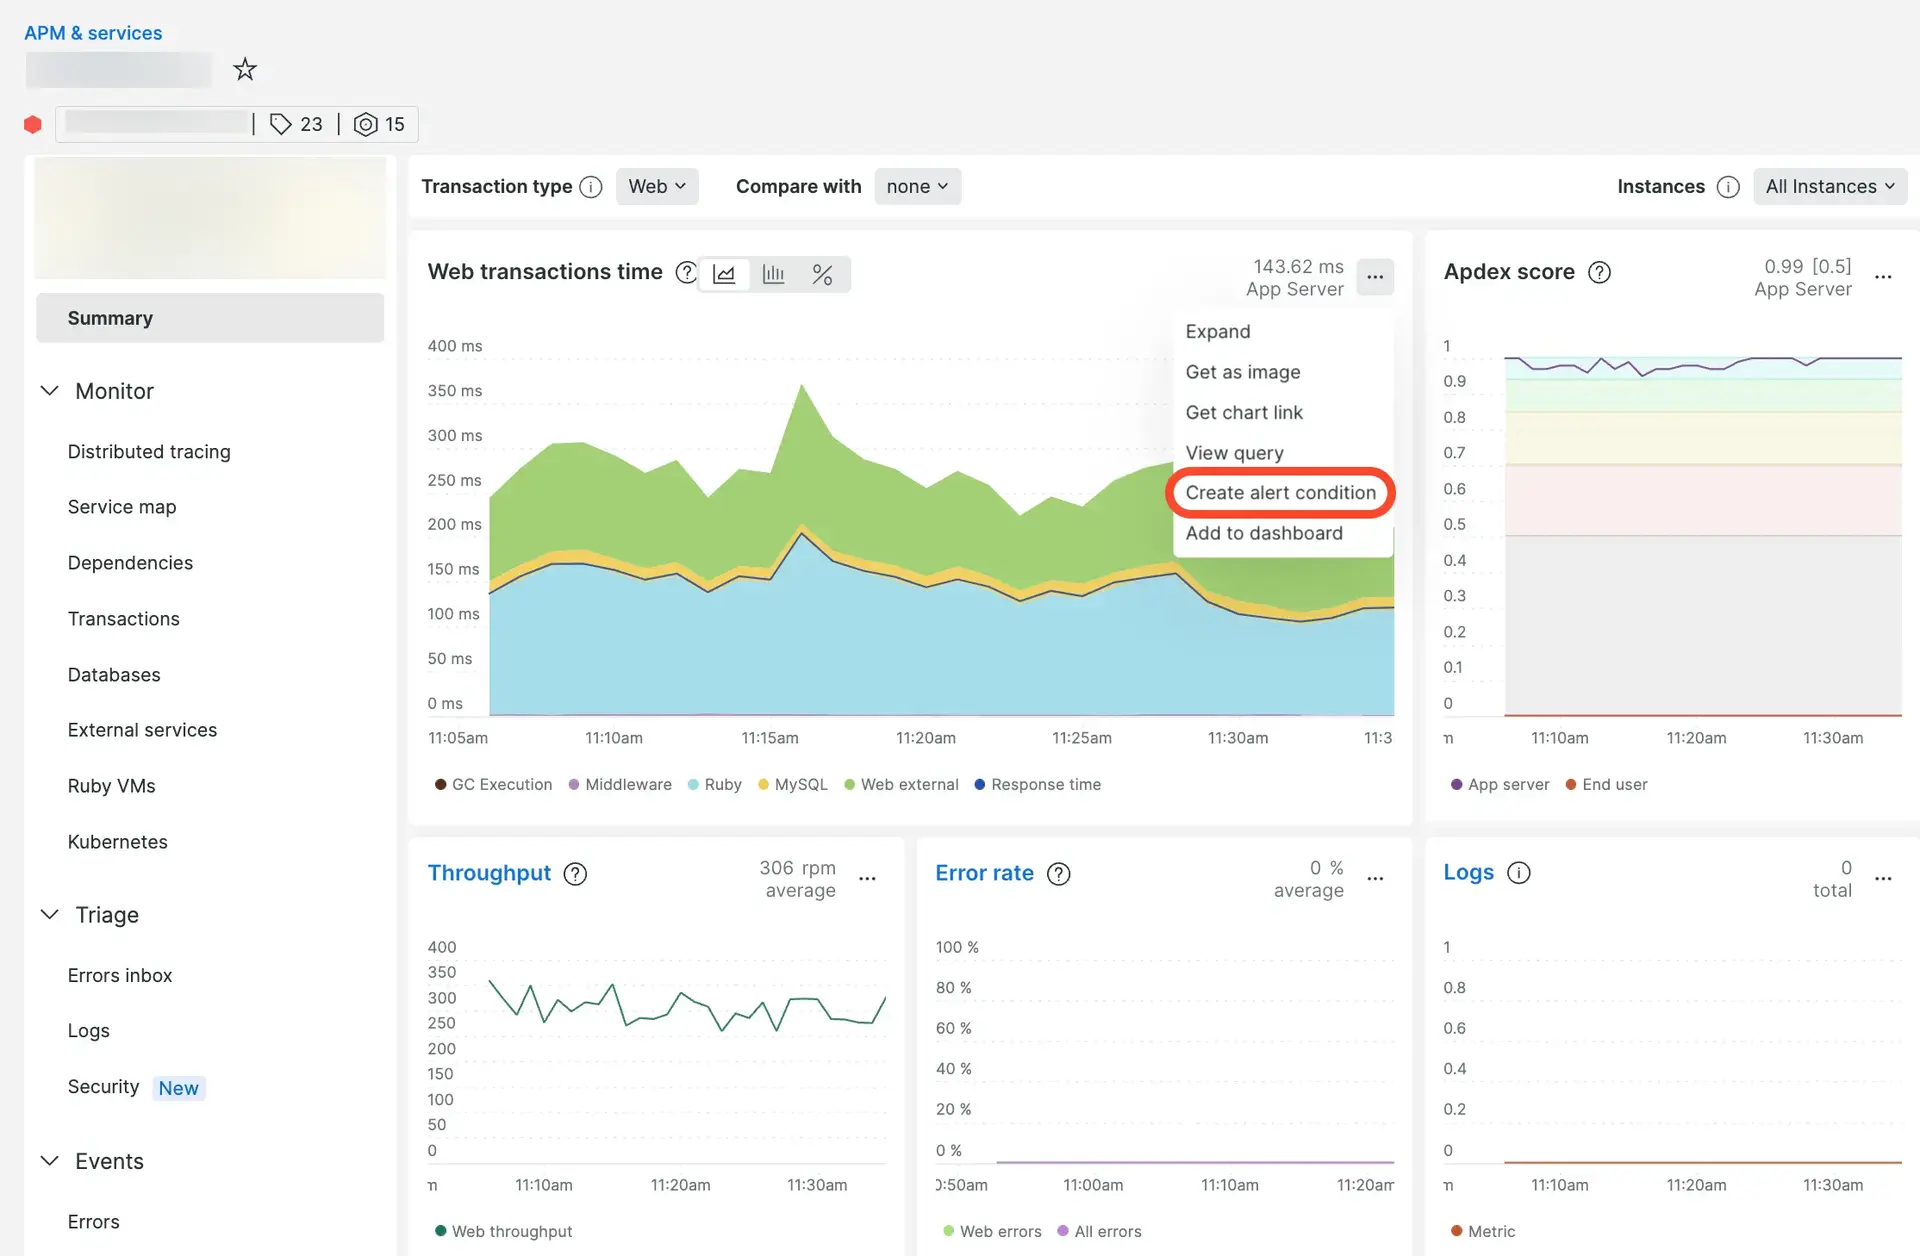
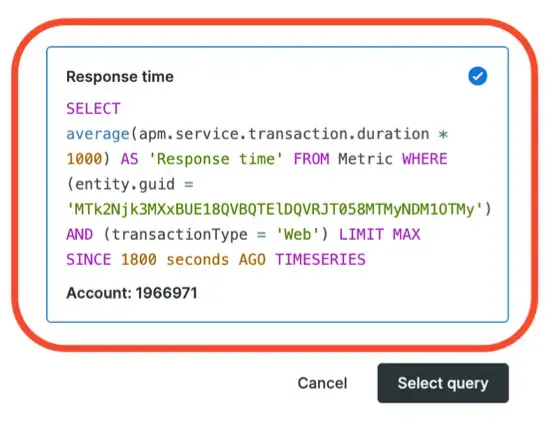
The easiest way to get started with alerts is to create an alert from a New Relic chart. This route is the same as creating a NRQL alert condition from scratch, but the chart already has a NRQL query for you to work with.
An alert condition is essentially a container that you create to define what conditions need to be met before you're notified of any unusual behavior. For this example, you're going to create an alert that notifies your team of any latency issues with web transaction time.
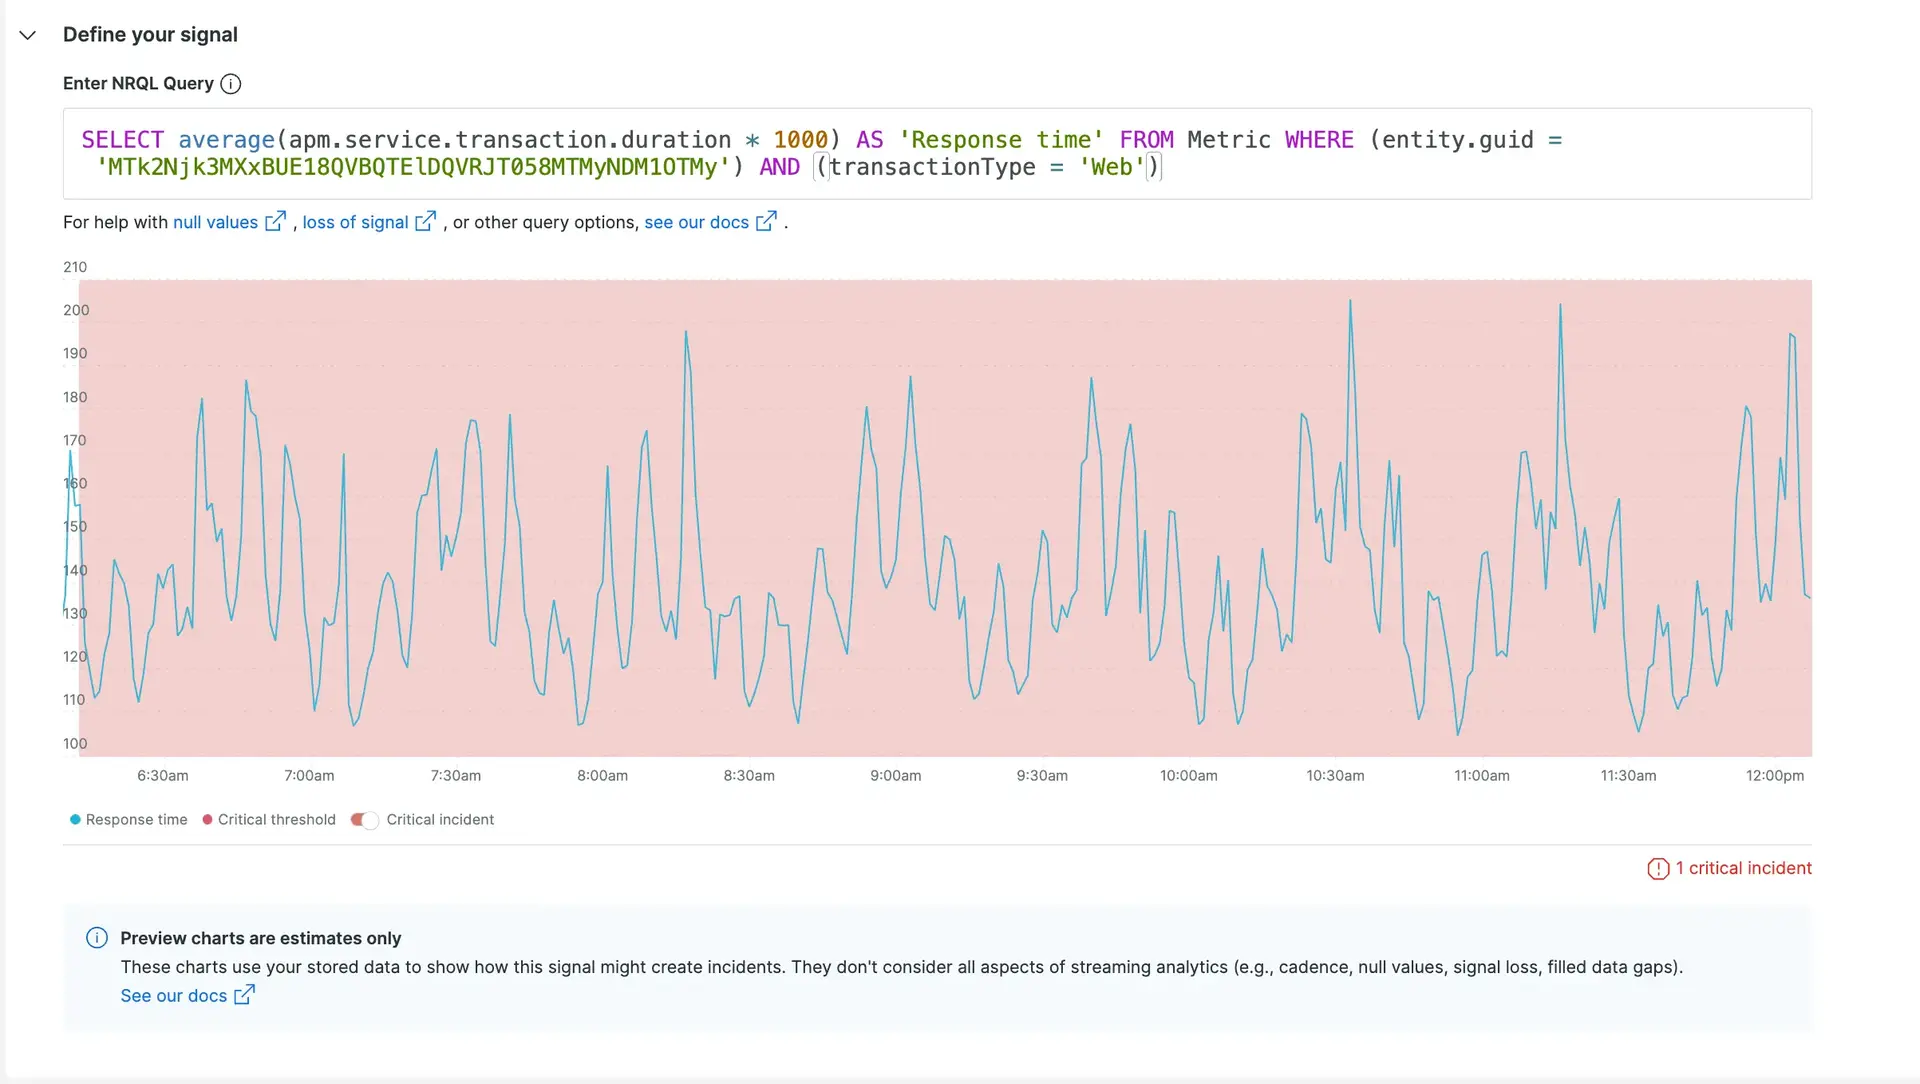
So, in this case, if you want to make sure that web transactions never take longer than 50 milliseconds, you'll build an alert condition to monitor when web transaction time goes beyond 50 milliseconds and creates an alert event.
Set thresholds for alert conditions
If an alert condition is a container, then thresholds are the rules that each alert condition contains. As data streams into your system, the alert condition searches for any alert events of these rules. If the alert condition sees data coming in from your system that has met all the conditions you've set, then it will create an alert event. An alert event is a signal that something is off in your system and you should take a look.
Your team is creating an alert condition to look for any latency issues in web transaction time. Now, you're going to create the rules this condition is going to look for.
Fine-tune advanced signal settings
New Relic constantly observes the data that streams from your applications and into our system. But not all applications send signals at the same frequency or cadence. Some events could send signals to our system once a minute while others could only report data to New Relic once every day. An alert condition is a specific container designed for a specific use case. When creating an alert condition this section is the most customizable for the data that you're evaluating.
We're going to customize these advanced signal settings for our condition that is looking for web transaction latency issues.
Connect your condition to a policy
If there are any latency issues with web transaction times, we'd like to receive a notification as soon as possible. The best quick and efficient action is to create an alert condition that will open an alert event if web transaction times take too long.
This alert condition is a container that holds all the rules—are we using static or anomaly thresholds, are we using a sliding-window aggregation or just leaving the evaluation period as normal?
At this point in the process we now have a fully defined container and we've set all the rules to make sure an alert event is opened when we want it to be. Based on the settings above, if our alert condition recognizes this behavior in our system that breaches the thresholds that we've set, it will create an alert event. Now, all we need to do is to attach this container to a policy.
The policy is the sorting system for the alert event. When you create a policy, you're creating the tool that organizes all of your incoming alert events. You can connect policies to workflows that tell New Relic where you want all this incoming information to go, how often you want it to be sent, and where.


