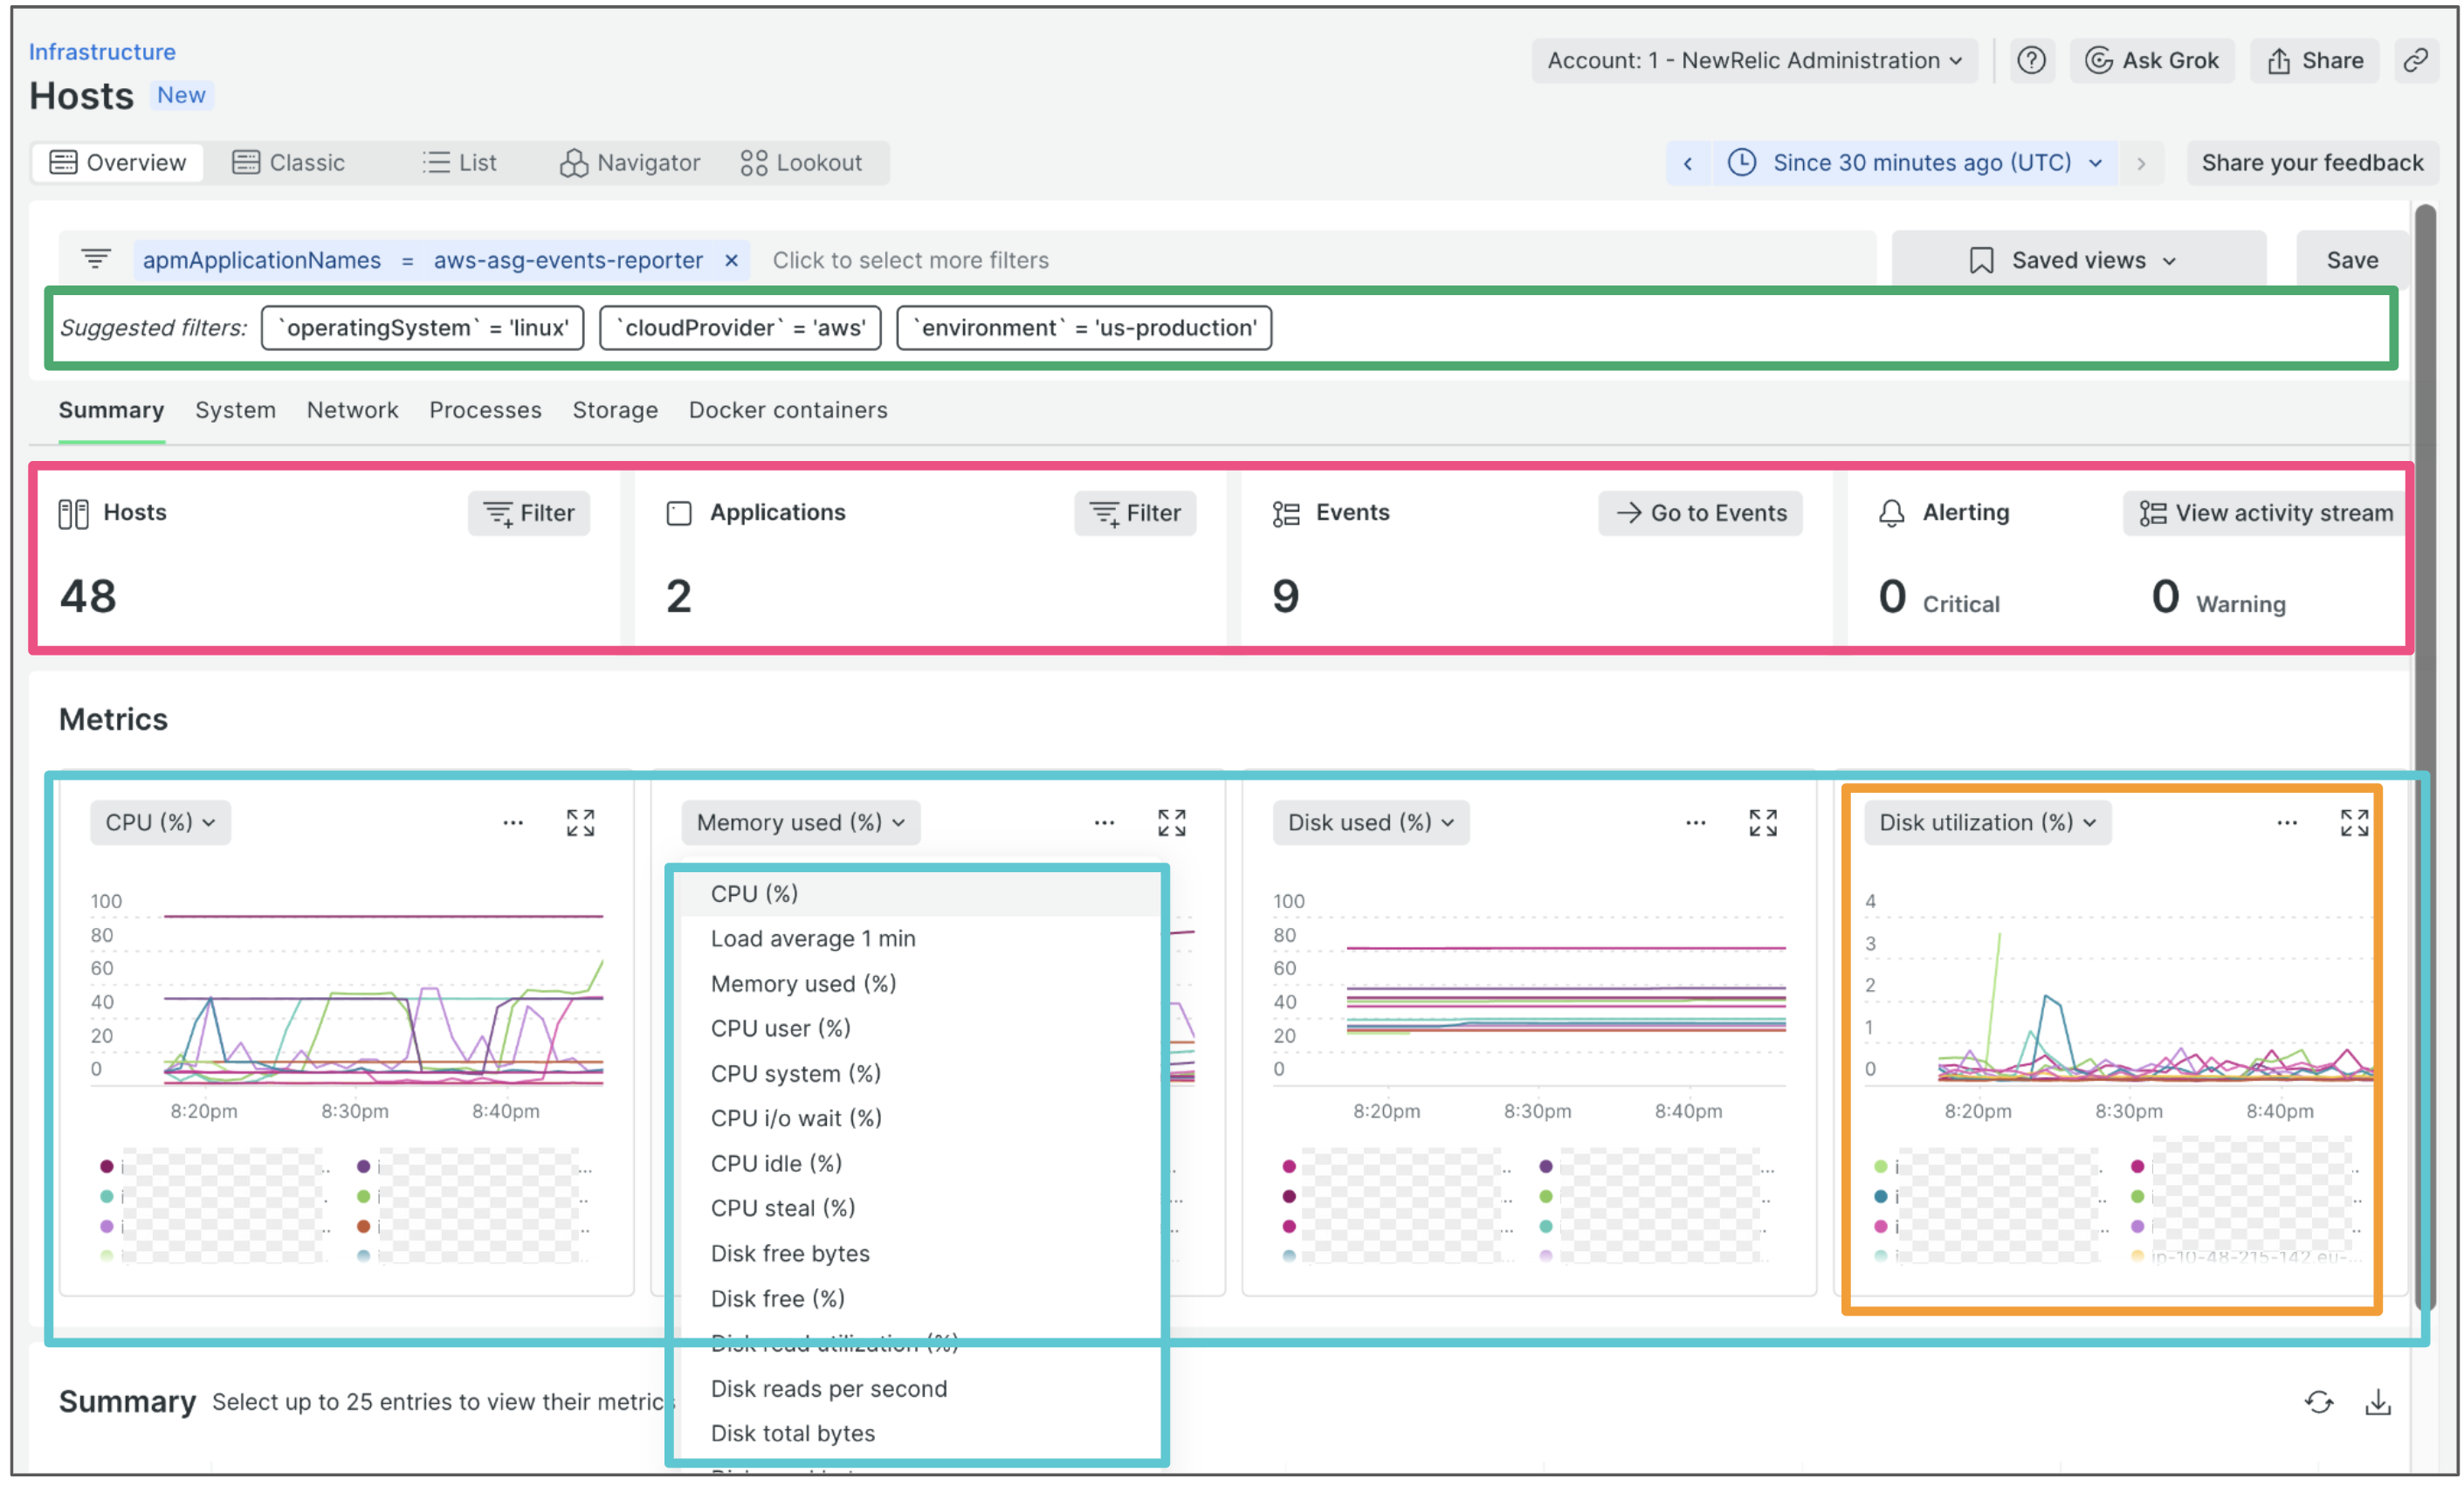
Our connected infrastructure and APM solution allows you to correlate your performance across infrastructure, APM, and the rest of your stack to remediate problems faster than ever, without swiveling between tools.
GA release enhancements
- Summary tab: View the performance of your hosts with interactive scorecards that include filtering options for both infrastructure and APM.
- Saved views: Get one-click access to the filters and metrics you use the most.
Solution overview
- Integrated infrastructure experiences inside APM: View CPU and memory for hosts, containers, and VMs within APM to instantly identify under-provisioned resources that are impacting applications.
- At-a-glance estate view: See the status and count of hosts, applications, and events (dynamically adjusted as data is filtered), along with an alerts activity stream to understand overall system health.
- In-context application health: Dynamic charts provide host- and APM-specific metrics to correlate drops in performance across infrastructure and the applications running on them.
- Embedded change tracking: Analyze how application deployments impact host performance.
- Related Entities Automap : Quickly identify the impacts to related infrastructure components and services during performance degradations using a visual map.
Get started
- Install the infrastructure monitoring agent
- Inside New Relic, select infrastucture monitoring to access new experience
Learn more:
