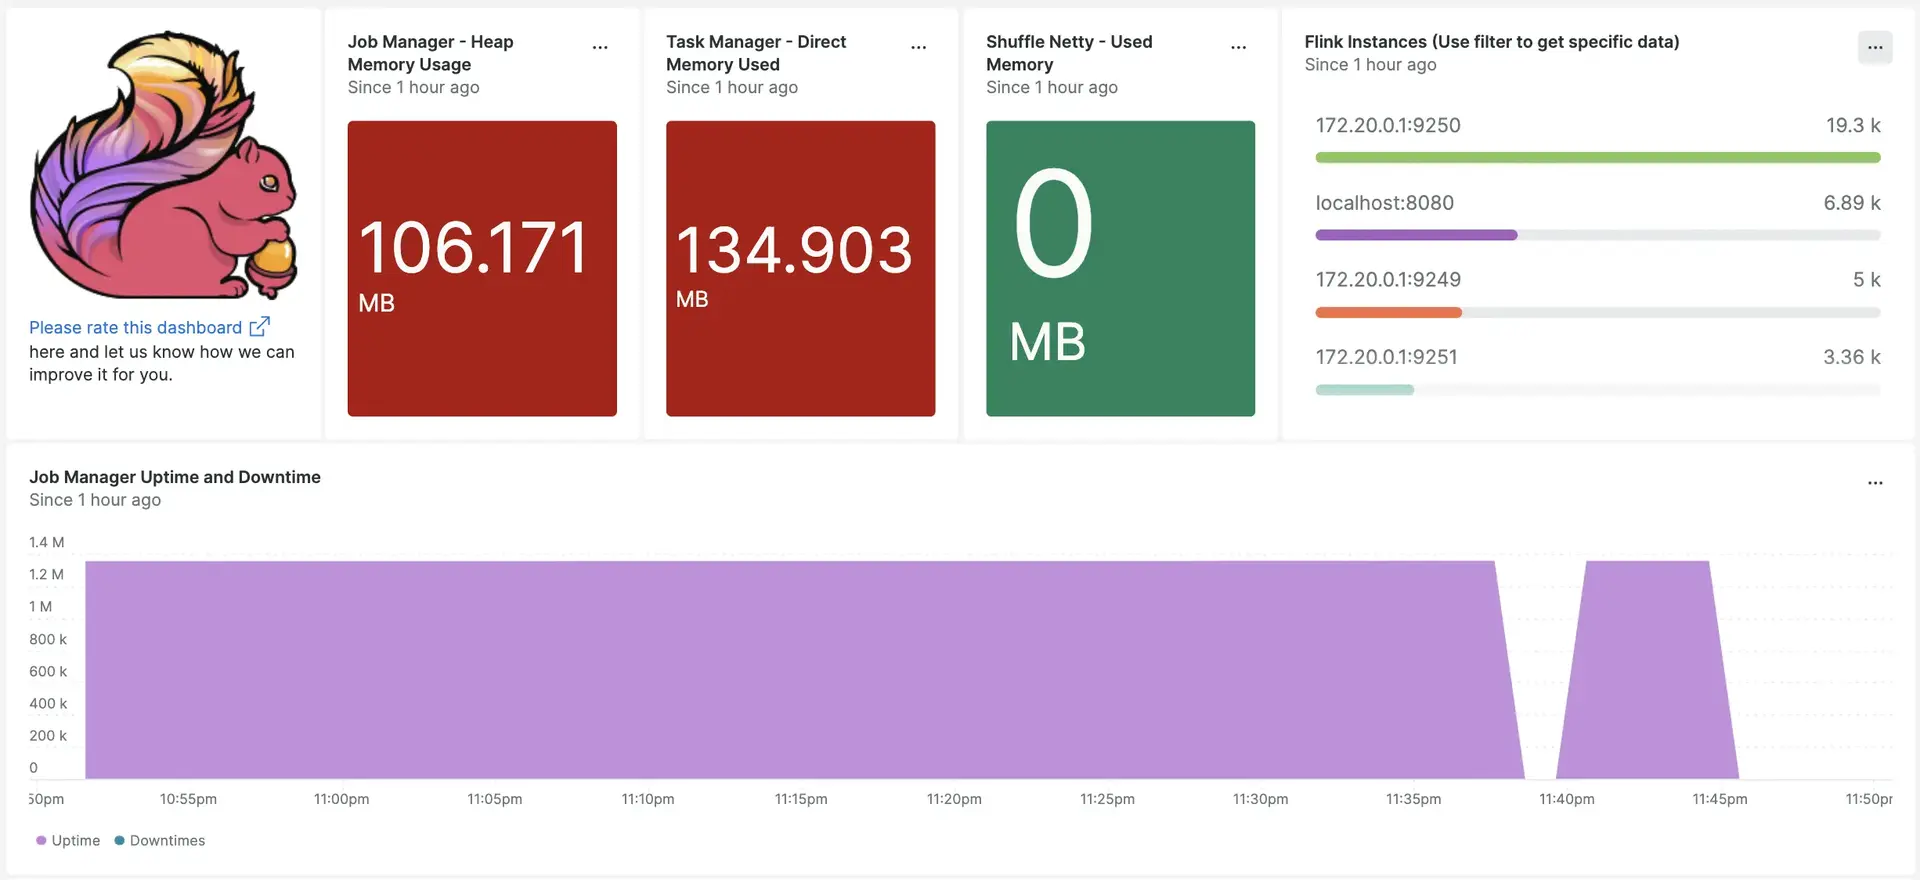
With our Apache Flink dashboard, you can easily track your logs, keep an eye on your instrumentation sources, and get an overview of uptime and downtime for all your applications' instances. Built with our infrastructure agent and our Prometheus OpenMetrics integration, Flink take advantage of OpenMetrics endpoint scraping, so you can view all your most important data, all in one place.

After setting up Flink with New Relic, your data will display in dashboards like these, right out of the box.
Install the infrastructure agent
Before getting Flink data into New Relic, first install our infrastructure agent, then expose your metrics by installing Prometheus OpenMetrics.
There are two ways of installing our infrastructure agent:
Through our guided install.
Install the infrastructure agent manually, via the command line.
Configure Apache Flink to expose metrics
You will need the Apache Flink prometheus jar file to expose metrics on a configured port. Ideally, on downloading the Apache Flink, the file named flink-metrics-prometheus-VERSION.jar will be placed in the below path.
File path: FLINK-DIRECTORY/plugins/metrics-prometheus/
Update the flink configuration file to expose metrics on ports 9250 to 9260
Apache Flink configuration file path: FLINK-DIRECTORY/conf/flink-conf.yaml
metrics.reporters: prommetrics.reporter.prom.class: org.apache.flink.metrics.prometheus.PrometheusReportermetrics.reporter.prom.factory.class: org.apache.flink.metrics.prometheus.PrometheusReporterFactorymetrics.reporter.prom.host: localhostmetrics.reporter.prom.port: 9250-9260Follow the below command to start an Apache Flink cluster
$./bin/start-cluster.shYou should now be able to see metrics on the below URLs
- Job manager metrics
http://YOUR_DOMAIN:9250- Task manager metrics
http://YOUR_DOMAIN:9251You may also cross check if there are any other task manager ports running on your PC by running the below command:
sudo lsof -i -P -n | grep LISTENConfigure nri-prometheus for Apache Flink
First, create a file named nri-prometheus-config.yml in the below path
Path: /etc/newrelic-infra/integrations.d
Now, update the fields listed below:
cluster_name: "YOUR_DESIRED_CLUSTER_NAME", for example:
cluster_name: "apache_flink"urls: ["http://YOUR_DOMAIN:9250", "http://YOUR_DOMAIN:9251"], for example:
urls: ["http://localhost:9250", "http://localhost:9251"]
Your nri-prometheus-config.yml file should look like this:
integrations:  - name: nri-prometheus    config:      standalone: false      # Defaults to true. When standalone is set to `false`, `nri-prometheus` requires an infrastructure agent to send data.      emitters: infra-sdk      # When running with infrastructure agent emitters will have to include infra-sdk      cluster_name: "YOUR_DESIRED_CLUSTER_NAME"      # Match the name of your cluster with the name seen in New Relic.       targets:        - description: "YOUR_DESIRED_DESCRIPTION_HERE"          urls: ["http://YOUR_DOMAIN:9250", "http://YOUR_DOMAIN:9251"]      #    tls_config:      #      ca_file_path: "/etc/etcd/etcd-client-ca.crt"      #      cert_file_path: "/etc/etcd/etcd-client.crt"      #      key_file_path: "/etc/etcd/etcd-client.key"
verbose: false # Defaults to false. This determines whether or not the integration should run in verbose mode. audit: false # Defaults to false and does not include verbose mode. Audit mode logs the uncompressed data sent to New Relic and can lead to a high log volume. # scrape_timeout: "YOUR_TIMEOUT_DURATION" # `scrape_timeout` is not a mandatory configuration and defaults to 30s. The HTTP client timeout when fetching data from endpoints. scrape_duration: "5s" # worker_threads: 4 # `worker_threads` is not a mandatory configuration and defaults to `4` for clusters with more than 400 endpoints. Slowly increase the worker thread until scrape time falls between the desired `scrape_duration`. Note: Increasing this value too much results in huge memory consumption if too many metrics are scraped at once. insecure_skip_verify: false # Defaults to false. Determins if the integration should skip TLS verification or not. timeout: 10sManually set up log forwarding
You can use our log forwarding documentation to forward application specific logs to New Relic.
On installing infrastructure agent on the linux machines, your log file named logging.yml should be present in this path: /etc/newrelic-infra/logging.d/.
If you don't see your log file in the above path, then you will need to create a log file by following the above log forwarding documentation.
Here is an example of the log name which will look similar as below:
- name: flink-u1-taskexecutor-0-u1-VirtualBox.logAdd the below script to the logging.yml file to send Apache Flink logs to New Relic.
logs: - name: flink-<REST_OF_THE_FILE_NAME>.log file: <FLINK-DIRECTORY>/log/flink-<REST_OF_THE_FILE_NAME>.log attributes: logtype: flink_logsRestart New Relic infrastructure agent
Before you can start reading your data, restart your infrastructure agent.
Monitor Apache Flink on New Relic
If you want to use our pre-built dashboard template named Apache Flink to monitor your Apache Flink metrics, follow these steps:
- Go to one.newrelic.com and click on + Integrations & Agents.
- Click on Dashboards tab.
- In the search box, search for Apache Flink.
- Click on the Apache Flink dashboard to install it in your account.
Once your application is integrated by following the above steps, the dashboard should reflect metrics on it.
To instrument the Apache Flink quickstart and to see metrics and alerts, you can also follow our Apache Flink quickstart page by clicking on the Install now button.
Use NRQL to query your data
You can use NRQL to query your data. For example, if you want to view the total number of completed checkpoints on New Relic's Query Builder, use this NRQL query:
FROM Metric SELECT latest(flink_jobmanager_job_numberOfCompletedCheckpoints) AS 'Number of Completed Checkpoints'What's next?
If you want to further customize your Apache Flink dashboards, you can learn more about building NRQL queries and managing your in the New Relic UI:
- Introduction to the query builder to create basic and advanced queries.
- Introduction to dashboards to customize your dashboard and carry out different actions.
- Manage your dashboard to adjust your dashboards display mode, or to add more content to your dashboard.