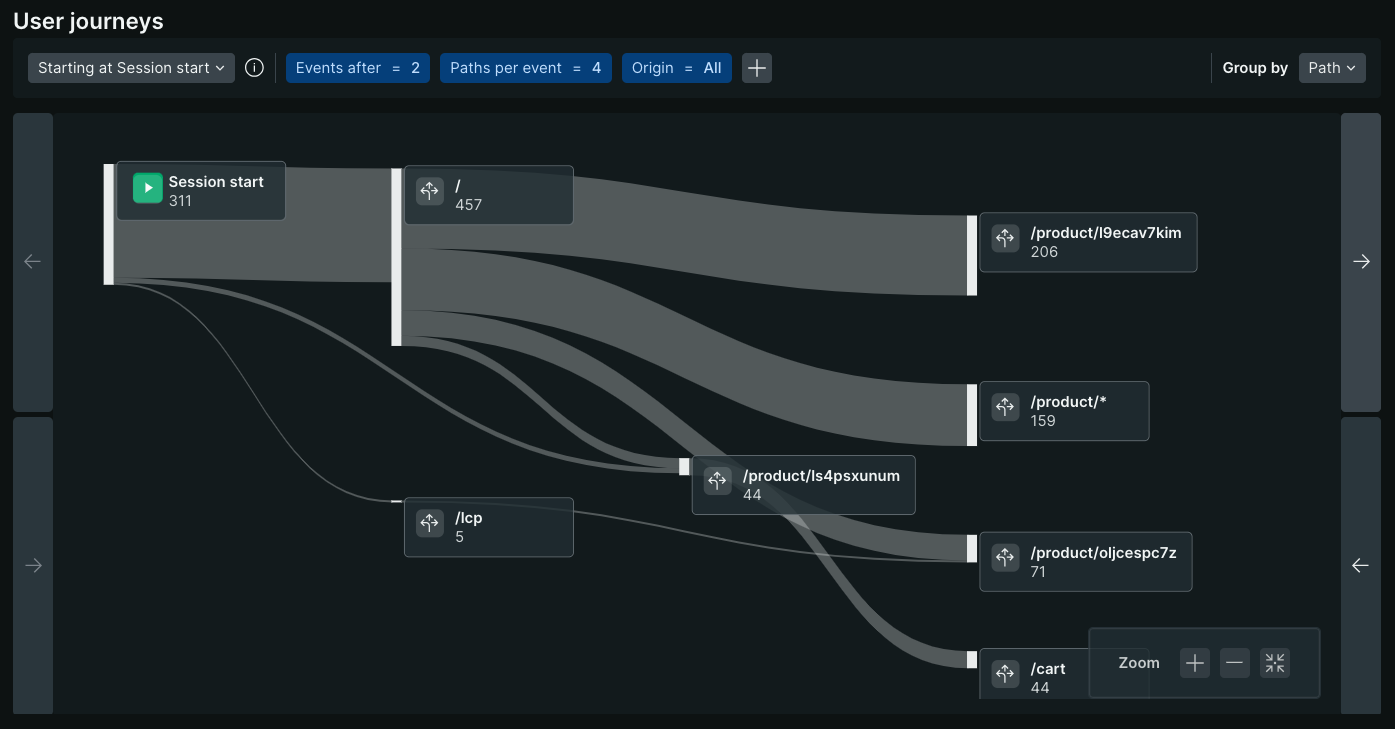
User Journeys visualizes how end-users navigate your site in aggregate, revealing critical insights into user behavior that can drive business success. Whether you're looking to optimize conversion funnels, reduce bounce rates, or improve overall user experience, User Journeys provides the data-driven insights you need to make informed decisions.

Why use User Journeys?
User Journeys helps you understand exactly how users move through your site, showing you where they get stuck, where they drop off, and which paths lead to successful conversions. This powerful visualization is essential for:
- E-commerce optimization: Identify which product pages lead to purchases and which cause cart abandonment
- Content strategy: Understand how users discover and consume your content, then optimize linking strategies
- UX improvements: Spot navigation pain points and design issues that frustrate users
- Conversion funnel analysis: See exactly where users exit your conversion process and why
- SEO and marketing: Optimize landing pages based on real user behavior patterns
Unlike traditional Sankey diagrams that follow a strictly columnar layout which often repeat the same value in multiple columns, ours reduces noise by only showing each value once with flexible pathing to represent the different steps it occurred at in each journey.
Note how /product/ls4psxunum only appears once despite being the first URL viewed for some sessions and the 2nd for others.
The Sankey diagram is constructed from your BrowserInteraction events collected by the SPA agent. The previousGroupedUrl and targetGroupedUrl attributes capture the paths users followed and become the paths on the chart.
重要
Since User Journeys relies on BrowserInteraction events, it is only available if you're using the SPA agent. The SPA agent works on both traditional and Single Page Application (SPA) web apps.
How to access User Journeys
To view User Journeys in the New Relic UI:
- Go to one.newrelic.com > All capabilities > Browser
- Select your browser application from the list.
- In the left navigation menu, click User Journeys.
Alternatively, you can navigate directly from other browser monitoring pages:
- From the Page views page, look for the User Journeys link in the navigation
- From Session traces, you can access User Journeys to see broader navigation patterns
After you're in User Journeys, you'll see the Sankey diagram visualization showing user flow patterns across your site.
How to use User Journeys
Types of journeys
There are three types of journeys that can be displayed:
Journeys starting at a certain event or URL
This option allows you to see where users navigated after the event of interest.
The default starting event is Session start which only includes sessions that began during the selected time period. It shows their landing URLs and subsequent navigation which is helpful in identifying the most common entry points and how effectively they convert users to view more pages.
Selecting Beginning of time period will show journeys from all sessions during the time period, regardless of whether the session began during the selected time period or not. This option is useful if you want a holistic view of journeys across all of your active sessions during the time period, regardless of when they started.
Journeys that contained a specified URL
Use this option if you want to see what users did both before and after the URL of interest. This is useful in correlating which previous behaviors lead to desired outcomes.
Journeys ending at a specified URL
Use this option if you want to see what users did before the URL of interest. This is useful when analyzing behaviors that led up to a desired behavior, like viewing the order confirmation page. It can also be used to diagnose problem areas, like which pages led users to visit the Help page.
Path and event details
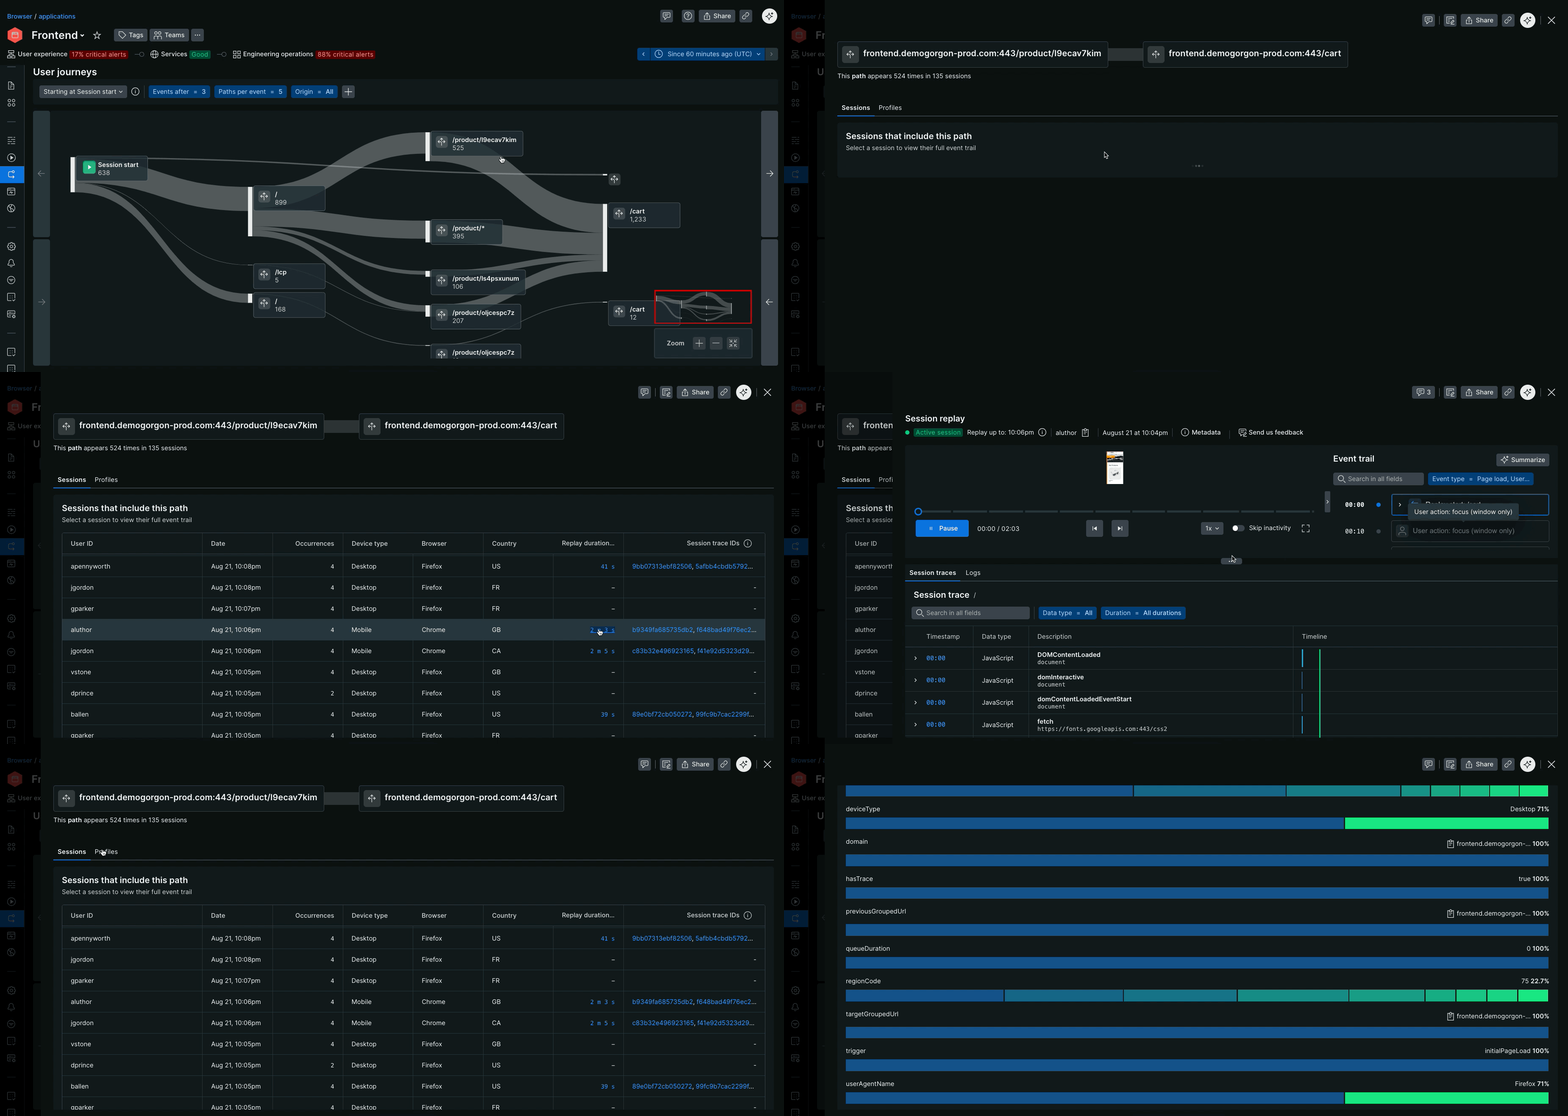
Clicking on an event or a path will show you a list of the sessions that followed that path. The list includes session attributes like browser and region along with links to any Session Replays or Session Traces that were collected on those sessions and pages.

There is also a
How to customize the visualization
Events before and after
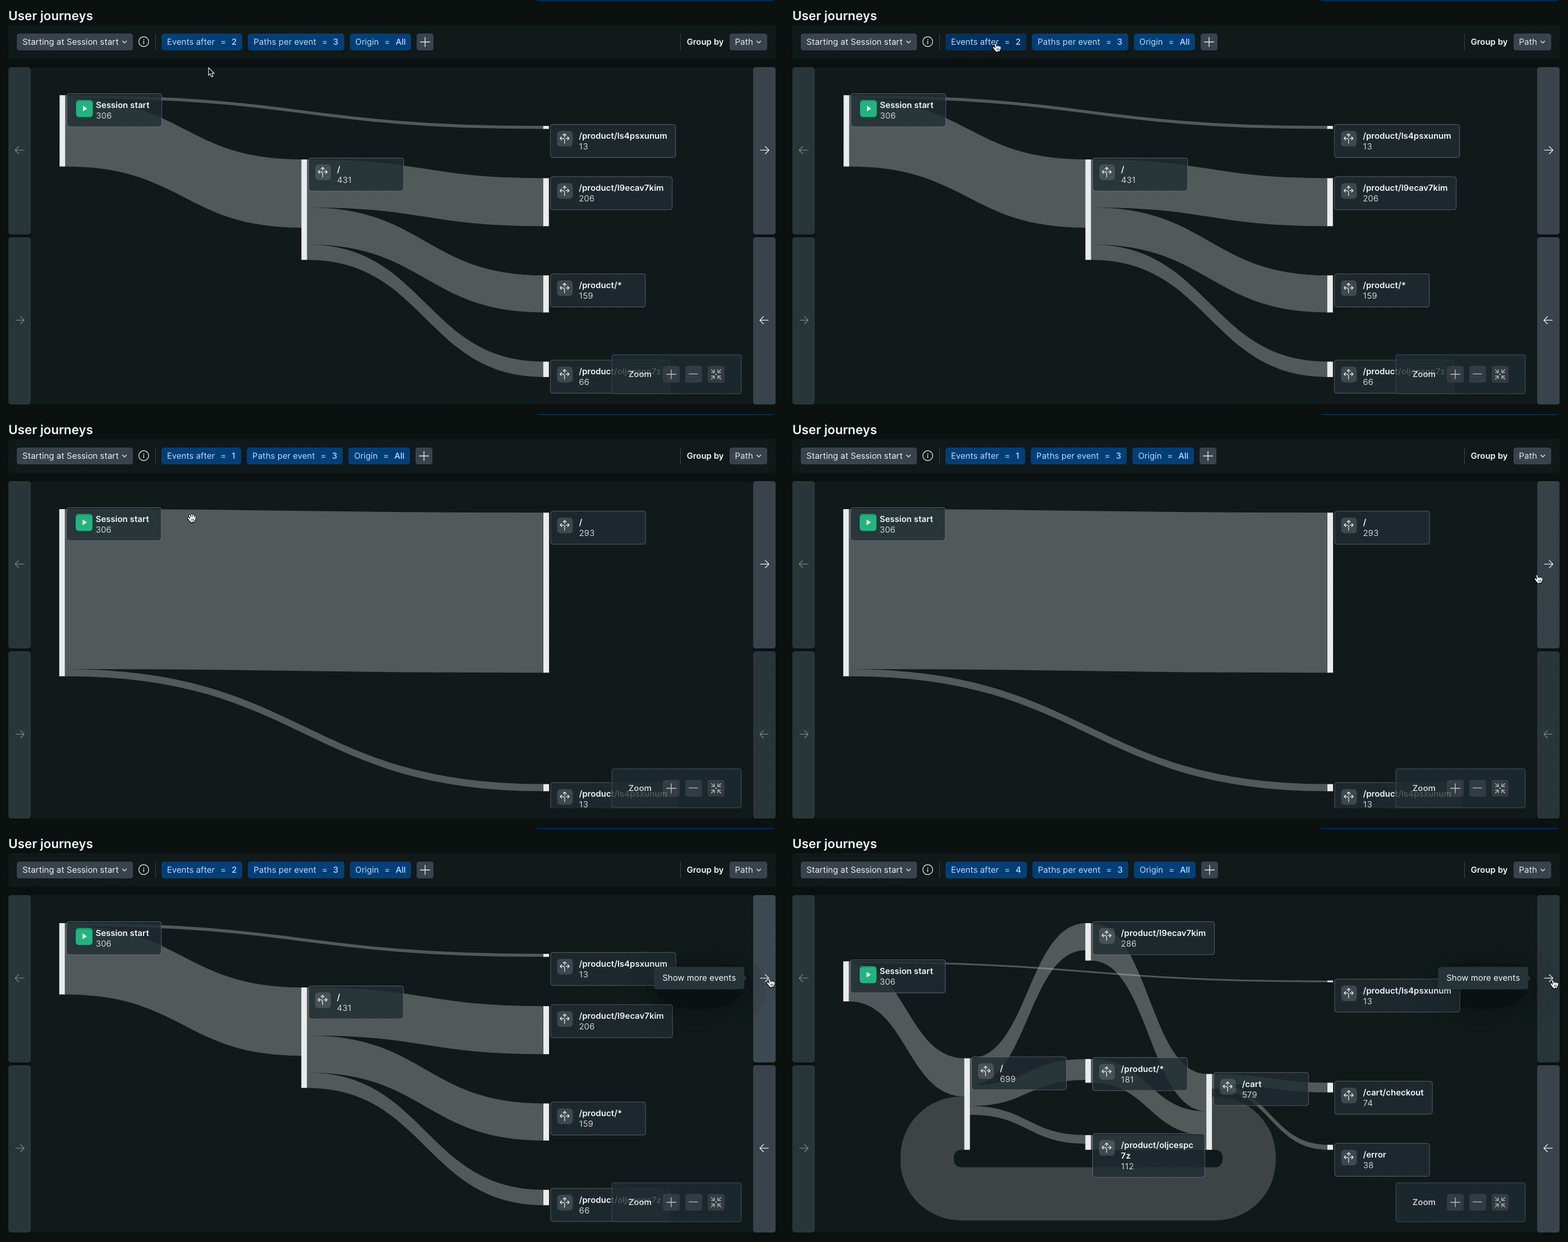
By default, we show the two URLs visited after the event of interest. Changing these values makes the chart wider or narrower by including more or less events before and after your event of interest. They can be updated either in the filter by or by clicking on the arrows on either side of the chart.

ヒント
The Starting at and Ending at journey types disable the Events before and Events after filters respectively, as the visualization will always start and end at the designated event.
Paths per event
This filter determines how many paths are shown after each event. By default, we show the top 5 paths with the most occurrences for each event. Decreasing this value focuses in on the most common paths while increasing it creates a more holistic, but noisier, view.
Origin
The origin filter allows you to choose which domains, subdomains, and protocols you want displayed in the chart. This is useful when your application is available from multiple origins and you want to focus your analysis on a subset of them.
Filter by session attributes
Use the plus button in the filter bar to display sessions that meet a certain criteria. For example, add countryCode = JP and userAgentName = Firefox filters to only show journeys from users in Japan using Firefox as their browser.
Group by
By default, we group by Path, which rolls up visits from different domains into the same event. For example, if you use the same agent on https://yoursite.com and http://www.yoursite.com, grouping by Path will aggregate visits to both either page as a single event labeled /.
Change the group by to URL if you would prefer visits to the same path but from different origins to be displayed separately. In the above example, there would then be two events on the chart. One for yoursite.com:443 and one for www.yoursite.com:80. This is helpful when comparing behavior from different origins, like when different regions are served by different subdomains or TLDs.