Problem
You have enabled distributed tracing but data you expected to see does not appear in New Relic's distributed tracing UI.
Before you start
Before performing troubleshooting, it may help you to:
- Review the technical details of how distributed tracing works.
- Use our instrumentation status app to see an overview of your trace instrumentation, including sampling rates. This can help you understand missing spans and fragmented traces. To find this, go to: one.newrelic.com > All capabilities > Apps > Distributed tracing instrumentation status.
Solutions
Here are some causes and solutions for missing trace data:
Problems with enabling or instrumenting
In order for distributed tracing to report details for all nodes in a trace, each application must be monitored by a New Relic agent that has had distributed tracing enabled.
If an application's New Relic account has not had distributed tracing enabled, it will have these issues:
- Its distributed tracing UI page won't have data.
- It won't report data to other accounts' distributed traces.
When you enable distributed tracing for applications and services that New Relic automatically instruments, you'll usually see complete and detailed data for those nodes in the distributed tracing UI.
However, you may notice that some services or applications are missing from traces, or that there are some internal spans you expect to see that are missing. If that's the case, you may want to implement custom instrumentation of applications or specific transactions to see more detail in traces. Some examples of when you may need to do this:
- Transactions not automatically instrumented. To ensure your application is automatically instrumented, read the compatibility and requirements documentation for the New Relic agent you're using. If an application isn't automatically instrumented, or if you'd like to add instrumentation of specific activity, see Custom instrumentation.
- All Go applications. The Go agent, unlike other agents, requires manual instrumentation of your code. For instructions, see Instrument a Go application.
- A service doesn't use HTTP. If a service doesn't communicate via HTTP, the New Relic agent won't send distributed tracing headers. This may be the case for some non-web applications or message queues. To remedy this, use the distributed tracing APIs to instrument either the calling or called application.
Problems with spans
If your agent can’t write data fast enough to the trace observer, queue_size is an additional APM agent configuration to limit the number of spans the agent will hold. See the following examples for your agent:
.NET configuration method | Example |
|---|---|
Configuration file | |
Environment variable | |
Python configuration method | Example |
|---|---|
Configuration file | |
Environment Variable | |
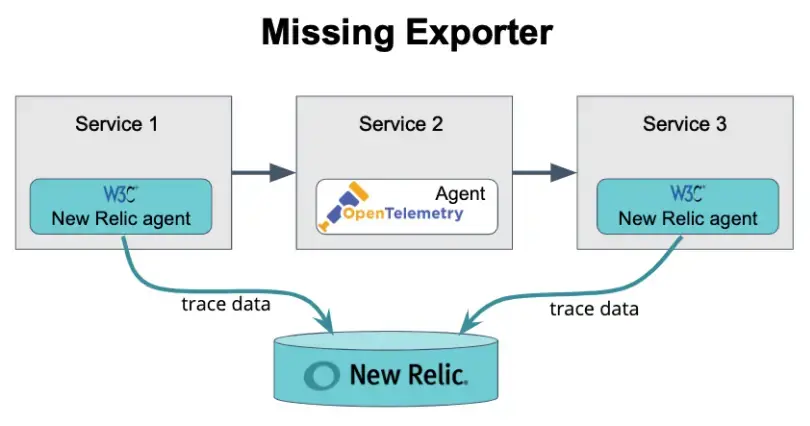
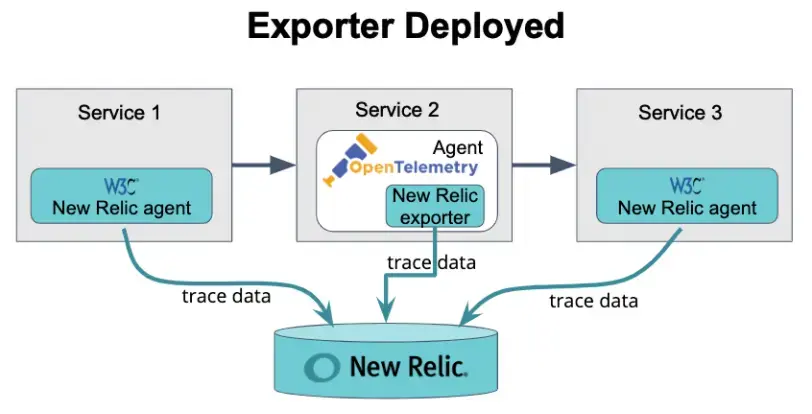
Sometimes header propagation is successful, but the span information isn't getting sent to New Relic. For example, if OpenTelemetry is not instrumented with a New Relic exporter, the span details never make it to New Relic.
In this diagram, notice that the header propagation is successful, but no exporter is set up in Service 2 to send the span to New Relic:

The following diagram also shows successful header propagation, but it includes an exporter in Service 2 that sends the span details to New Relic (see Trace API):

Standard distributed tracing for uses adaptive sampling. This means that a percentage of calls to a service will be reported as part of a distributed trace. Specific calls to your service might not have been selected to be sampled.
There are limits on the number of spans that can be collected and displayed. If an application generates a very large number of spans for a single call, it might exceed the APM agent's span-collection limit for that harvest cycle. This could result in missing spans and significantly limit the number of traces the agent can completely sample and report.
We currently only show 10,000 spans at a time.
Spans must be sent within the last sixty minutes to be captured in a trace index. If you send any spans older than sixty minutes but newer than a day, the span data will still be written. However, it won't be rolled into the trace index, which controls the trace list in the distributed tracing UI. If a span has a timestamp older than a day, it will be dropped. This often occurs when there is clock skew (timing differences) between systems or long running background jobs.
Important
Any spans sent via the OpenTelemetry Protocol (OTLP for short) that are longer than sixty minutes will not be written to NRDB, producing the following NrIntegrationError:
The span timestamp cannot be older than 60 minutes.Problems with trace details
If your transactions are only sending the proprietary New Relic header, some middleware might not recognize the format and then drop the information as shown in this diagram:

One solution is to upgrade your New Relic agent to a version that supports W3C trace context. In the diagram below, the W3C-compliant New Relic agent passes the prior header along with two standardized headers:

Some potential problems with proxies and other intermediaries:
Incomplete trace. Some intermediaries won't automatically propagate the distributed tracing header. In that case, you must configure that component to allow the header to be passed from source to destination. For instructions, consult the documentation for that intermediary component.
Missing intermediary in trace. If the intermediary is New Relic-monitored, ensure that it propagates the
newrelicheader that is generated or updated by the New Relic agent running on that intermediary. This may manifest when an intermediary was previously visible in traces, but disappeared after distributed tracing was enabled for an upstream entity (for example, a browser-monitored application).Tip
If some entities report trace data to another tracing system, you can use the trace ID from the New Relic UI to search other tracing systems for missing spans.
If each agent in a chain supports W3C Trace Context, then we can stitch the spans together into a complete trace. If part of the chain is from an agent, such as Zipkin, which doesn't support W3C Trace Context, then spans coming from that agent may not be included in the trace.
If a trace contains data from applications monitored by multiple New Relic accounts, and your user permissions don't allow you to access those accounts, some of the span and service details will be obfuscated in the UI.
For example, you may see a series of asterisks (*****) instead of the service name in your distributed tracing list if you don't have access to the account linked with the service.
The trace list is generated by trace indexes, which are captured in a twenty minute window from when the first spans are received.
Usually, this is due to late spans.
If you're seeing unusually short backend times for long traces, this is likely an issue with the timestamps being sent.
For example, the root span might be reposting microseconds as milliseconds. This can also happen if the root span is a browser application. When using an external client like a web browser, you may experience clock skew (timing differences) more often.
Problems with browser applications
Older versions of some agents are incompatible with distributed tracing for browser applications. If the browser application makes an AJAX request to an APM application running an incompatible agent, then the APM agent may not record transaction and span data for that request.
If distributed tracing is enabled for a browser application and you are not seeing transaction or span data for downstream APM requests, review the browser data in distributed tracing requirements, and confirm that all applications are running supported versions of the APM agent.
If traces seem to be missing end-user spans, be sure you've read and understand the browser distributed tracing requirements and enable procedures.
On the AJAX UI page, there are links to the distributed tracing UI regardless of whether there are end-user spans present in that trace. For details about what data generates spans, see Requirements.
Older versions of some agents are incompatible with distributed tracing for browser applications. If APM spans are missing consistently from traces that include browser applications, please refer to the browser data in distributed tracing requirements and confirm that all applications are running supported versions of the APM agent.
For other causes of orphaned browser spans, see Browser span reporting.
Other problems
Potential cause: For applications that have multiple app names, the entity.name attribute will be associated only with the primary app name. To search by other app names, search using the appName attribute.
Questions about integrating with OpenTelemetry should be taken to the Support Forum.
Other factors affecting access
For more on factors that can affect your ability to access New Relic features, see Factors affecting access.