Failed AJAX and fetch calls, like a broken third-party integration or a backend API returning a 500, often cause broken pages and confusing user experiences. The Request errors page groups these failed requests so you can find the API calls behind broken pages, see how often they're failing, and know where to start debugging.
Request errors is built on the AjaxRequest events your Browser agent already collects, so there's nothing to install or turn on to start using it.
View the request errors page
To view the request errors page, go to one.newrelic.com > All capabilities > Browser > (select an app) > Request errors.
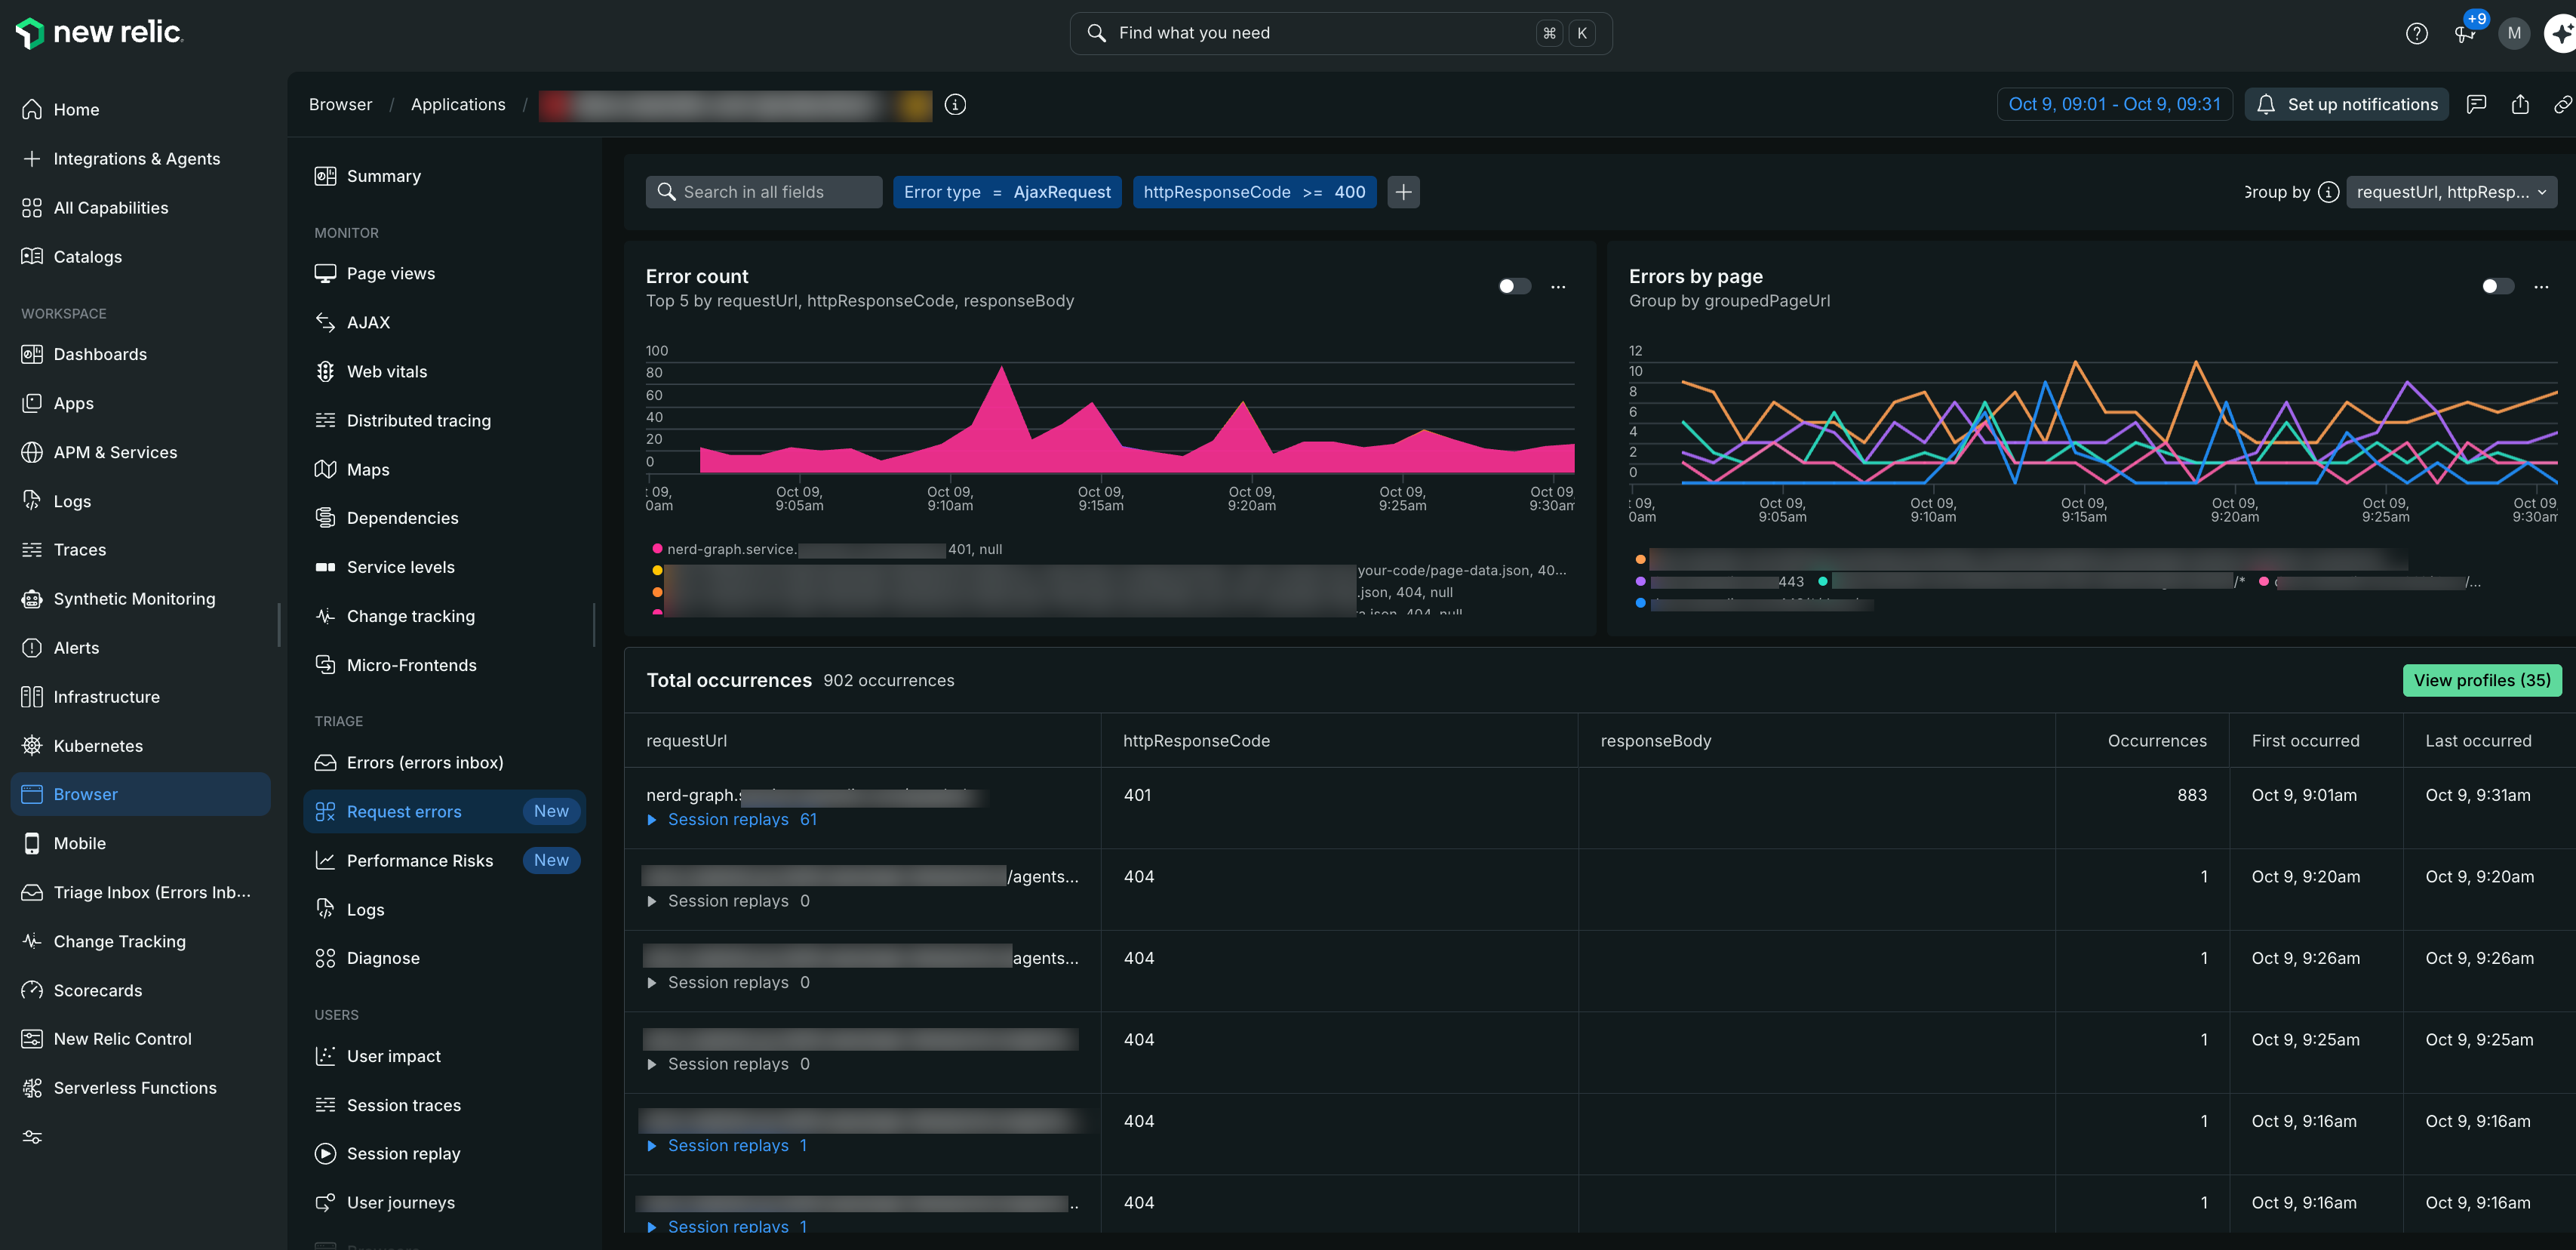
Recommended workflow
We recommend the following approach to investigate request errors, so you can understand the error, identify contributing factors, and start debugging:
- See overall trends: Start with the Error count and Errors by page charts to see at a glance whether there are any unexpected spikes, dips, or patterns.
- Group and filter: Use the Group by and filter options to focus on specific request domains, request paths, response codes, or code ranges.
- Drill down into a single error: Select a row in the request error table to view the full request details, including the request URL, response code, response body, and more.
- Review session replays and the event trail: From a specific error, review the event trail and, where available, the session replay recorded during that occurrence.
- Query and share the data: On any chart, select the … menu and then View query to explore the underlying
AjaxRequestdata in the query builder, or add it to a dashboard. - Change the time window: Select a new time period from the time picker dropdown.
Request error details
Select a row in the request error table to open the request details as a stacked panel, showing the full request information, request attributes, and response body for that error.
Profiles
From the request error table, select View profiles to see which attributes most distinguish this group of request errors from your other traffic. Use profiles to quickly spot what the affected requests have in common.
Event trail
When you select a specific error, the event trail shows the browser interactions and AJAX calls that led up to it. This helps you understand what the user was doing when the request failed, and whether other calls around the same time were also affected.
Session replay
Where a session replay was recorded for the occurrence you're viewing, you can open it from the error details to see exactly what the user experienced when the request failed.
Query and visualize request error data
New Relic saves request error data as AjaxRequest events. Query the AjaxRequest event type in the query builder to run NRQL queries and build dashboards from your request error data.