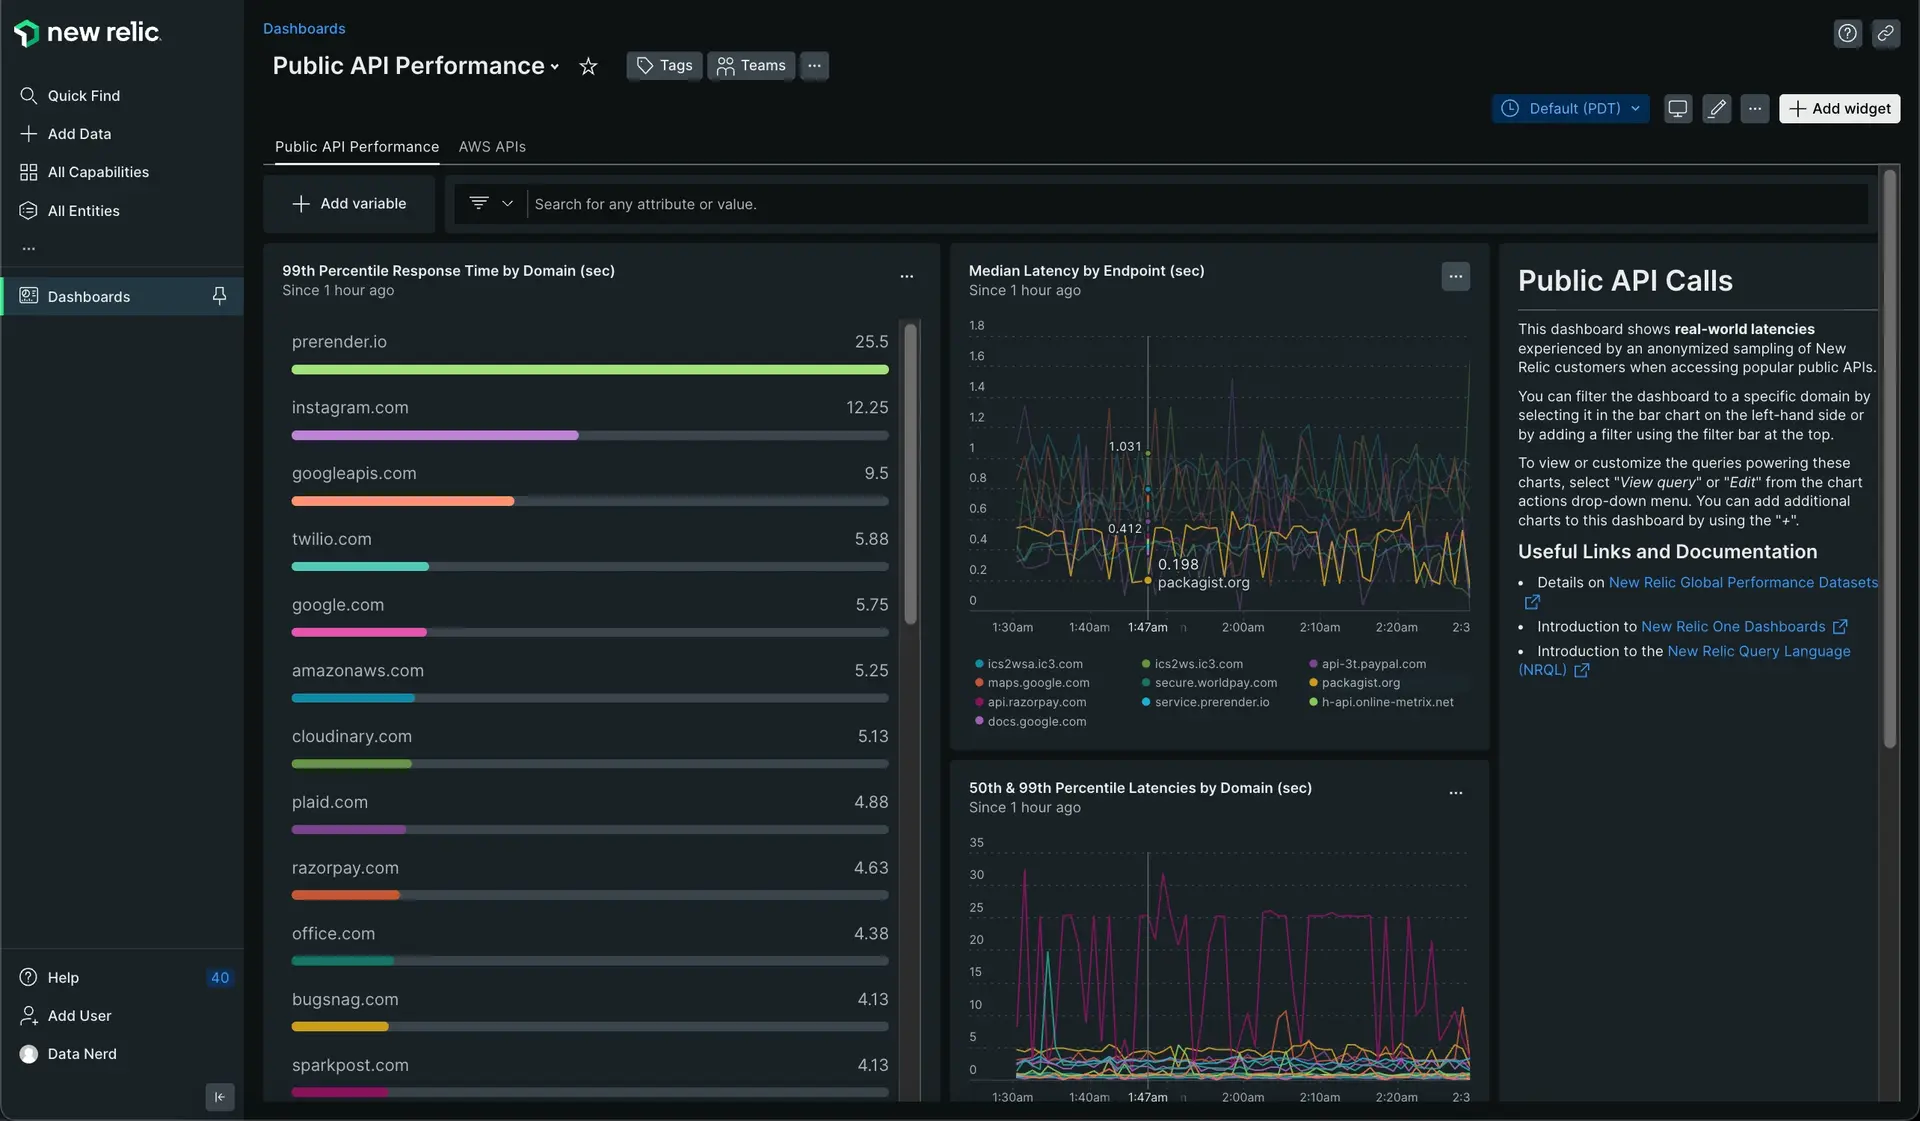
The Public API Performance dashboard is an out-of-the-box dashboard included as part of your New Relic account. It provides both actionable general insights about the performance of public APIs and an opportunity for new customers to test-drive our dashboarding capabilities before adding their own data.
The dashboard works by showing real latencies experienced by an anonymized sampling of New Relic customers when accessing popular public APIs.
Important
Global Performance data sets are presented as-is. Global Performance data sets represent an aggregate of samples across a range of sources, and New Relic makes no effort to attempt to confirm the correctness, completeness, or veracity of the data. This data should not be relied on as the sole source of information for any purpose you may use it, and New Relic is not responsible for decisions made in reliance on this data. Global Performance data sets should not be viewed as either an endorsement or a recommendation by New Relic of the technologies represented in the data sets.
Add the dashboard in New Relic
To add the Public API Performance dashboard:
- From the dashboards page, search for the Public API Performance pre-built dashboard. You can click the View All link next to the popular pre-built dashboards title to search it.
- Select the dashboard.
- Select an account from the dropdown.
- Click View dashboard to add it to your account.

Public API Performance dashboard
Explore the dashboard
You can customize your new pre-built dashboard. You can change the name and settings, add new content and new widgets, refine the charts, and more! See Manage your dashboard for more info.
Below are some suggestions for how to explore the Public API Performance dashboard.
- Click the icon on the right corner of any of the charts and select View query to view the NRQL query used to create the chart.
- Click the icon on the right corner of any of the charts and select Get as image to view or download any chart as an image.
- Select specific domains from the bar chart or add a filter by clicking the text field along the at the top of the page.
- If you've already added your own data, experiment with copying queries and modifying them for your own use.
Important
The Public API Performance dashboard is not currently available to EU customers.
Important
The Public API Performance dashboard doesn't currently support alerts.
Data reported
We make public API data available to all New Relic organizations via the Public_APICall event. This data doesn't count towards your ingest. If you want to see the structure of that data, run this query:
FROM Public_APICall select keyset()More about dashboards and data
- For more information about New Relic dashboards, see our dashboards introduction.
- Customers can also dive into this data set in greater depth using our data explorer.