The workloads UI gives you various views to understand your New Relic workloads at a high level, and in granular detail.
To view your workloads, go to one.newrelic.com and click Workloads.
Summary
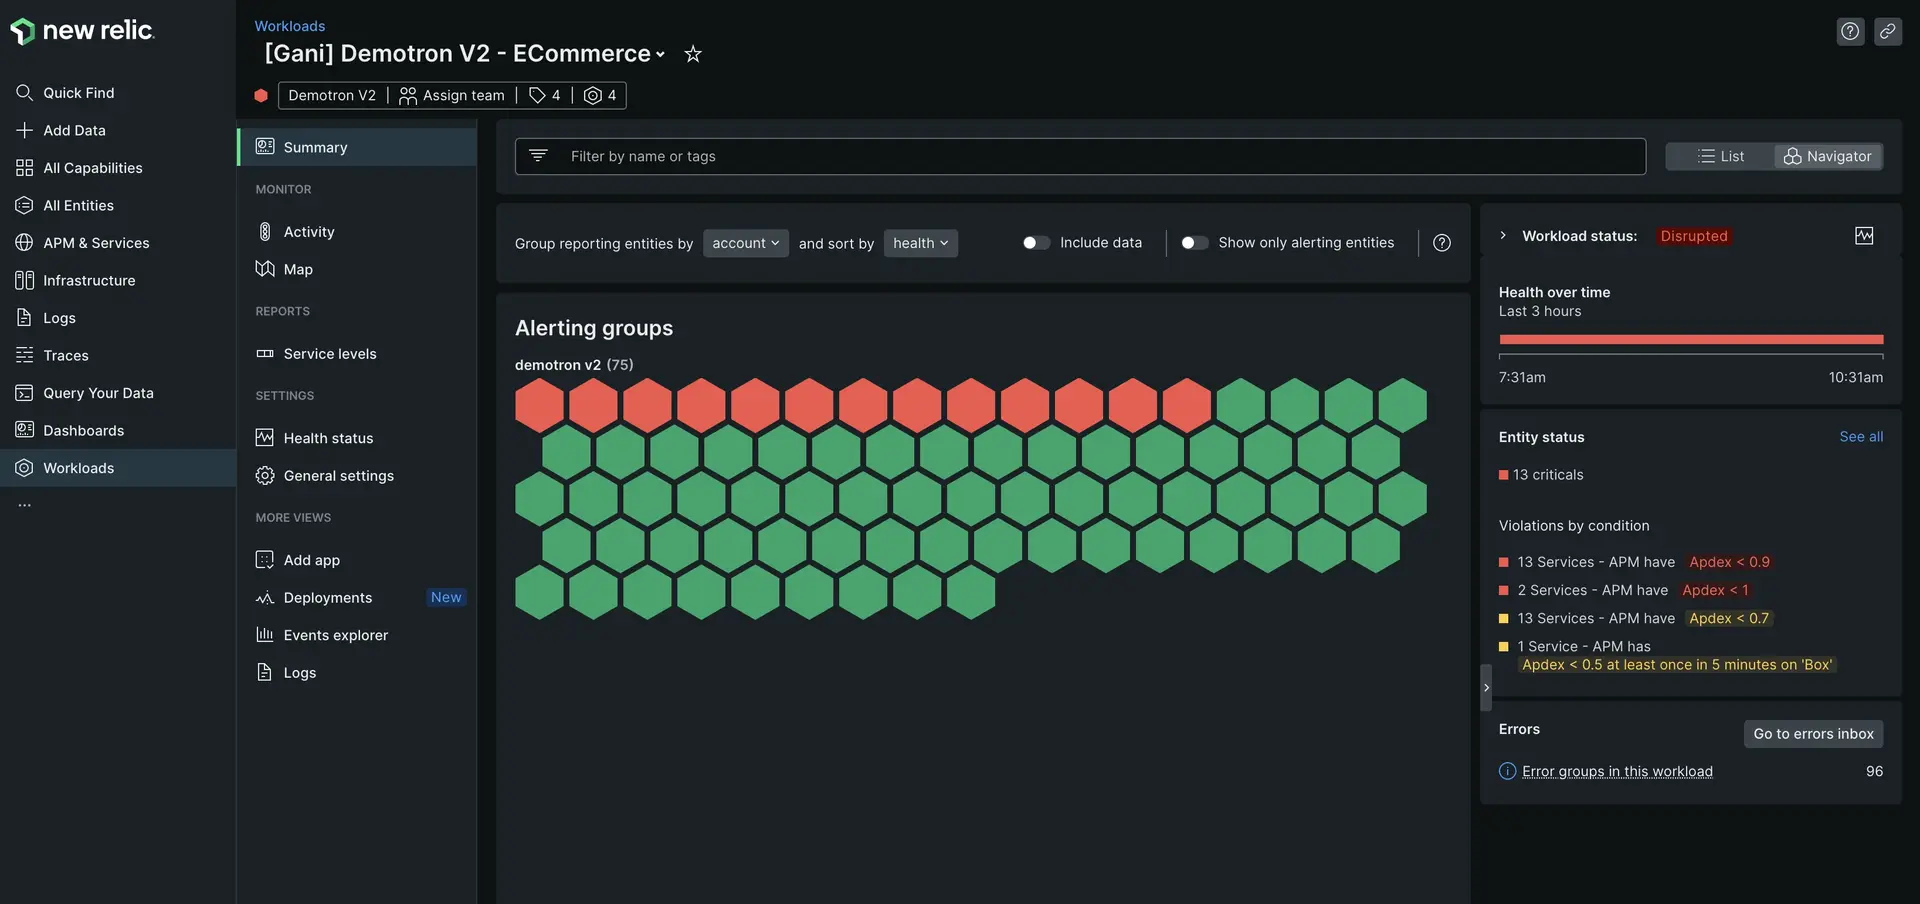
The Summary page provides relevant status data that helps you operate the workload. It shows the global status of the workload, as well as the individual status of all the entities that make up the workload at each point in time.

It comprises the following:
- The navigator view shows the entities that make up the workload, and provides controls to group and sort them.
- The workload status informs about how your workload is performing, based on the alerting status of the entities in your workload. The health over time shows you how the workload status has changed in the past three hours.
- If entities are alerting, you'll see a count of criticals and warnings and a summary of the open conditions, which helps you identify and troubleshoot the most important issues.
Save views of multiple workloads
If you often need to see the status of a certain group of workloads, you can save views that contain only those workloads.
To create a view:
- Go to one.newrelic.com > All capabilities > Workloads.
- Click on the
Edit viewicon. - Give the view a meaningful name (such as the name of a team or business unit), and select an account to associate the view with.
- Select the workloads you want to include in the view, by their name or tags.
Status views are most useful for teams that are accountable for more than one workload, support roles, and business unit managers.
Activity
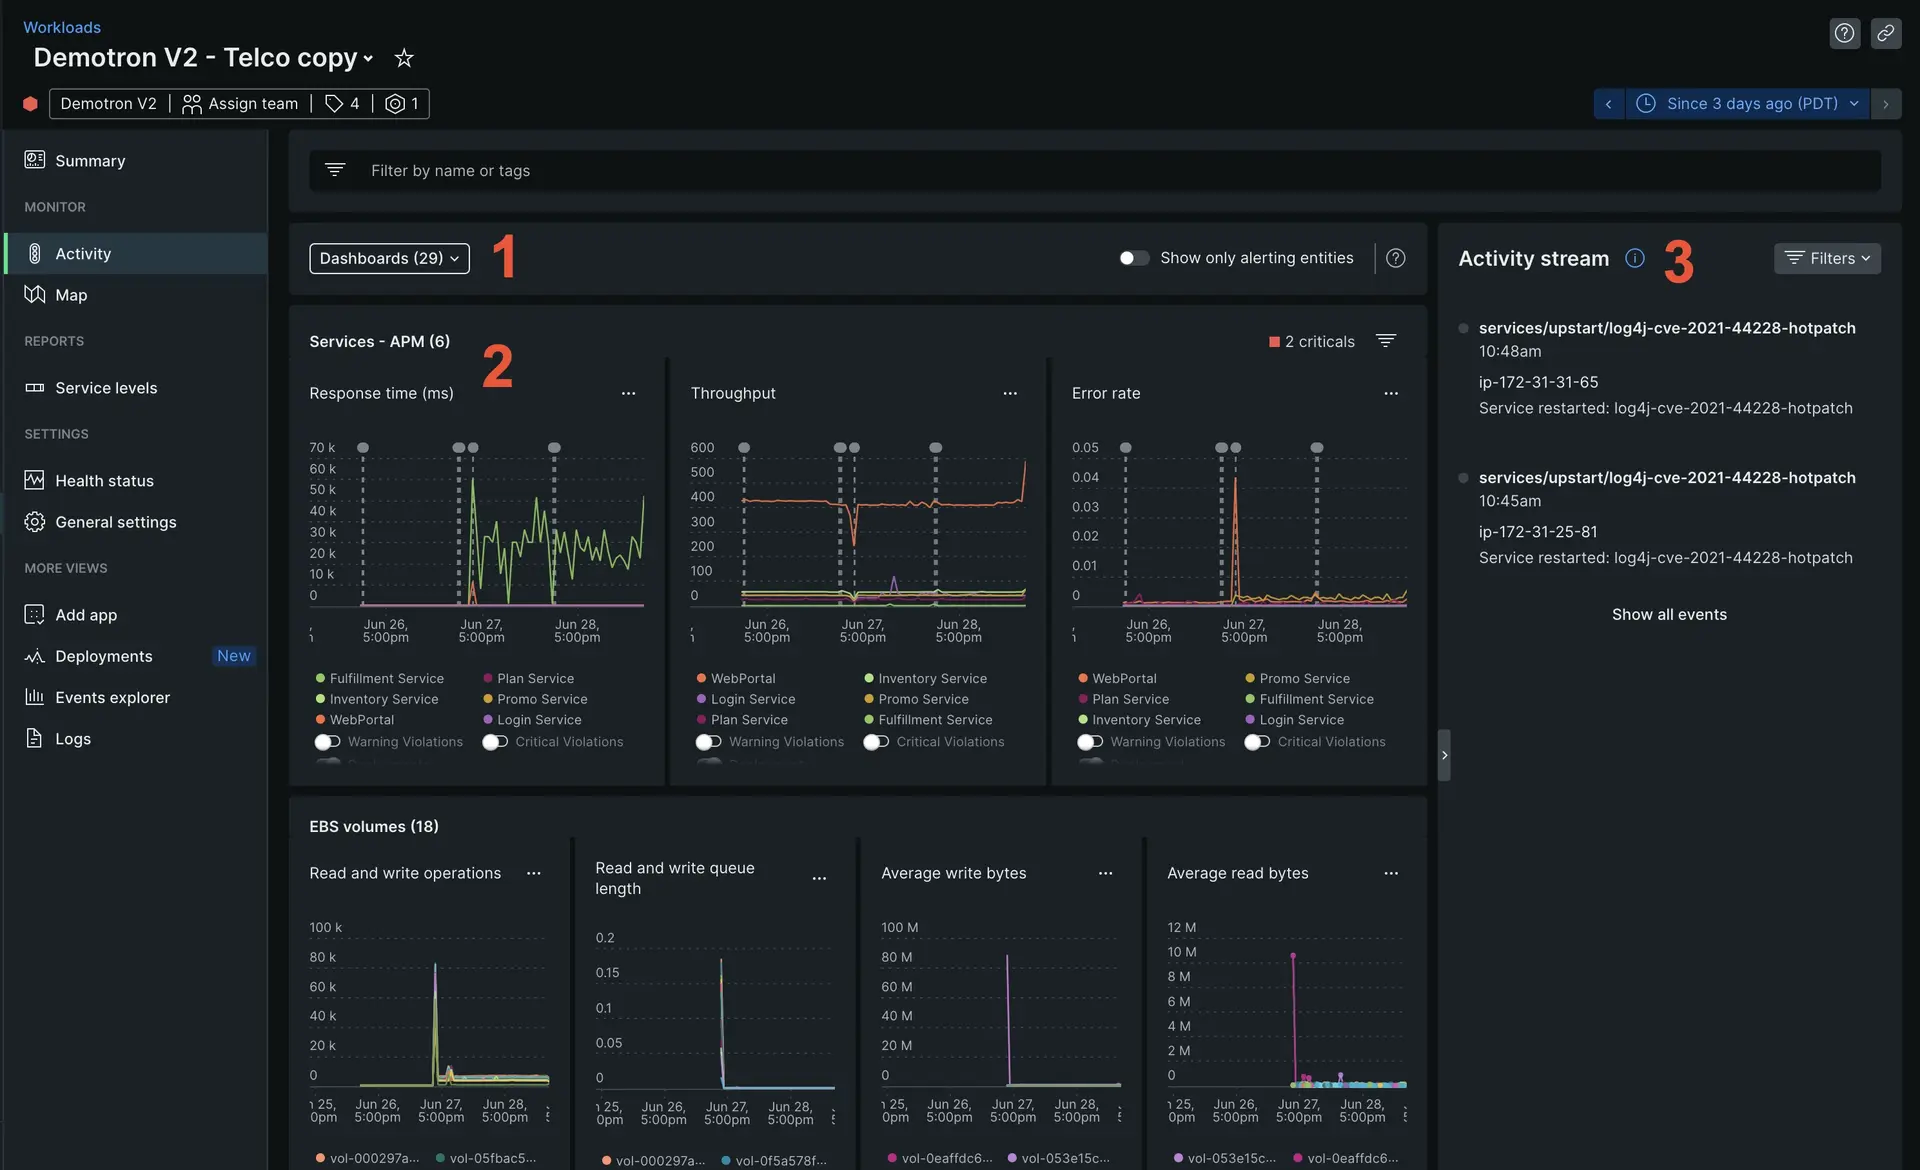
The Activity page shows performance data related to the entities in the workload, along with the events that could explain any changes in those time series.

Here are some of the most important sections:
- Linked dashboards. From here, you can add related dashboards to your workloads, including links to pre-filtered dashboards.
- Golden metrics. These are charts with the most relevant metrics for each entity type. Explore the charts to detect correlations among different entities (for example, two applications) and different stack layers (for example, applications and hosts). The metrics you see can be customized either at the account or the workload level through our NerdGraph API.
- Activity stream. This includes the start and end time of incidents and anomalies that refer to the workload entities. It also shows other event types that can explain a change in the status or performance of the workload, such as deployments and configuration changes.
View workloads maps
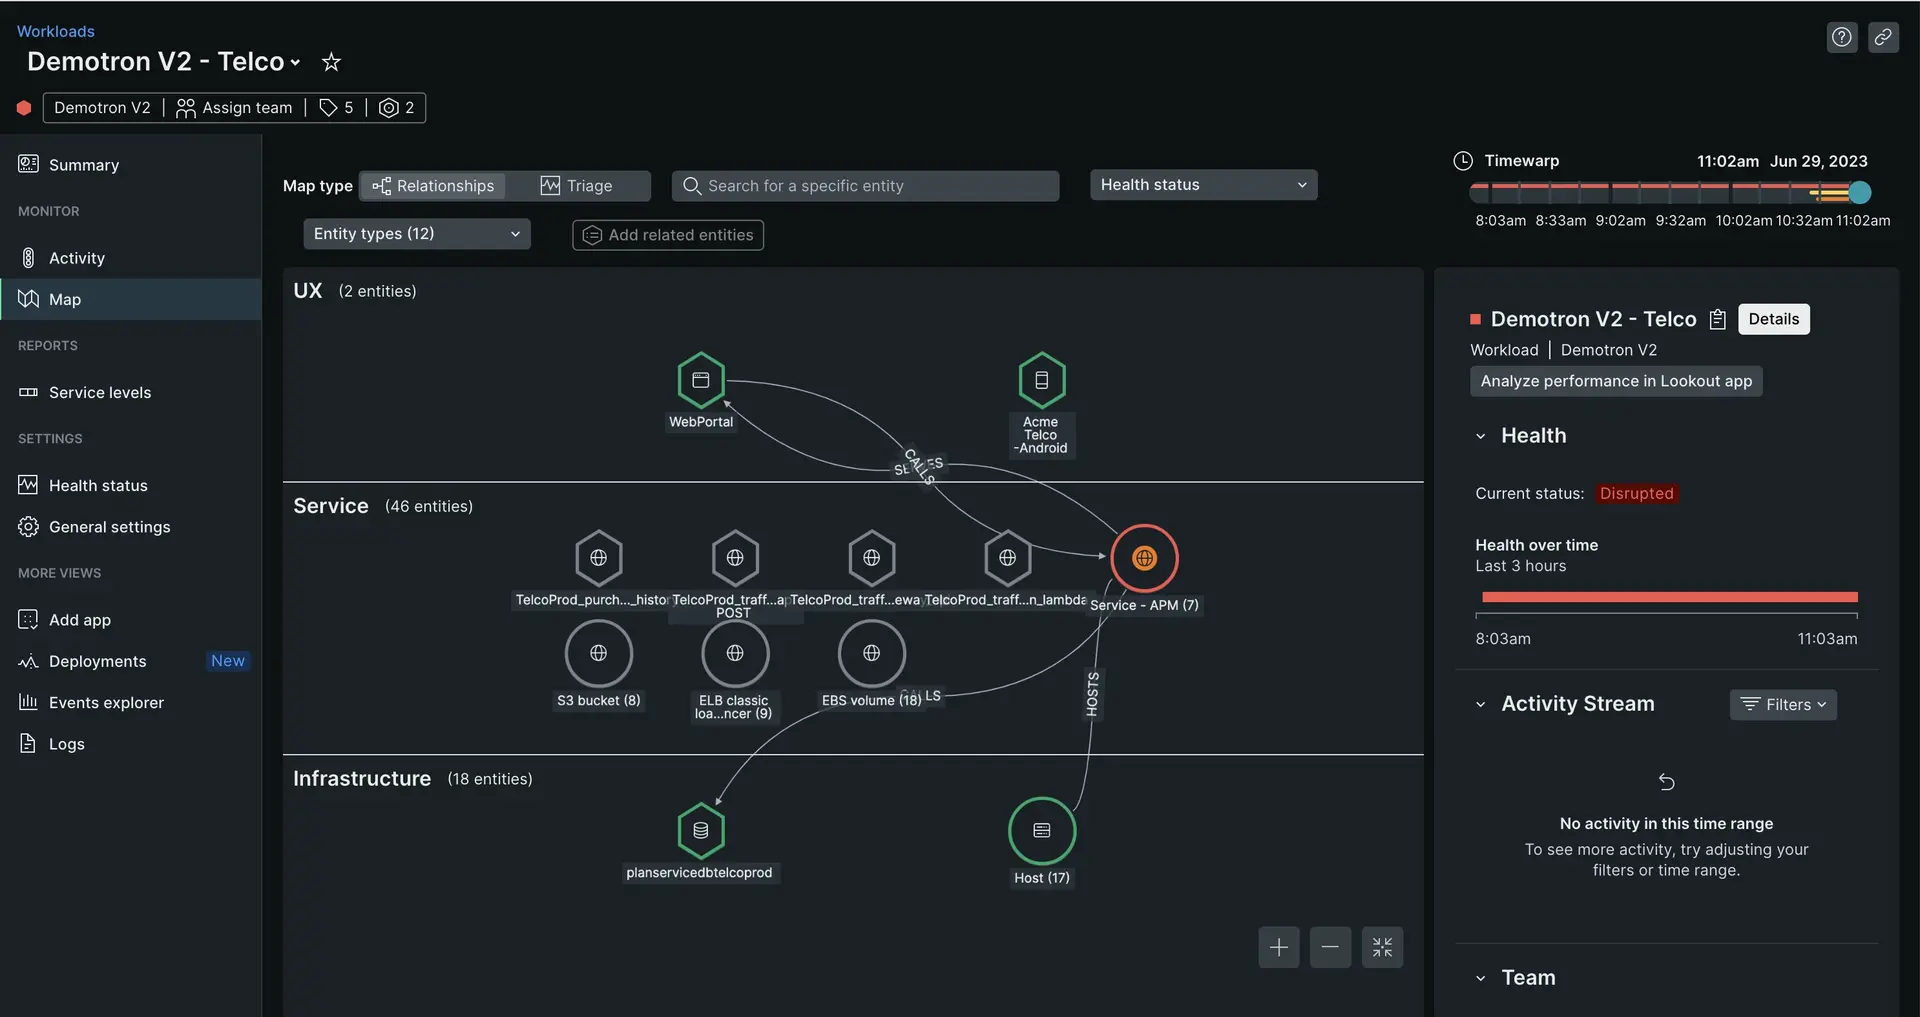
You can view a map that displays how the entities in your workload relate to and affect one another.

To learn more about this map, see Maps in context.
Health status
For details about this page, see Status configuration.
General settings
The General settings page gives you information about the team responsible for the workload. It contains:
- The team responsible for the workload. You can include more than one team.
- The workload description. Share the purpose of the workload, and the business logic it represents: Is it a web application? An API? A backend process? Fill in details relevant to your team, or to other teams in your organization.
- Contact information. From the drop-down menu, choose how your team prefers to be contacted.
- Links to the most relevant resources to operate the workload. Here you can add links to runbooks, code repositories, productivity tools, or anything else.