When system performance suffers, you need to know if it's due to your code, your infrastructure, or the underlying network. And you need to know fast, so you can focus your efforts. With network monitoring you can correlate and analyze application, infrastructure, digital experience, and network data all in one place, and understand how network performance and overall system performance impact each other.
Tip
Network monitoring is now included in the New Relic FedRAMP Moderate authorization!
Use the guided installs for SNMP, network flows, and network syslog to automatically detect and configure the FedRAMP-authorized API endpoints, or review the manual setup process in our docs for SNMP, network flows, and network syslog.

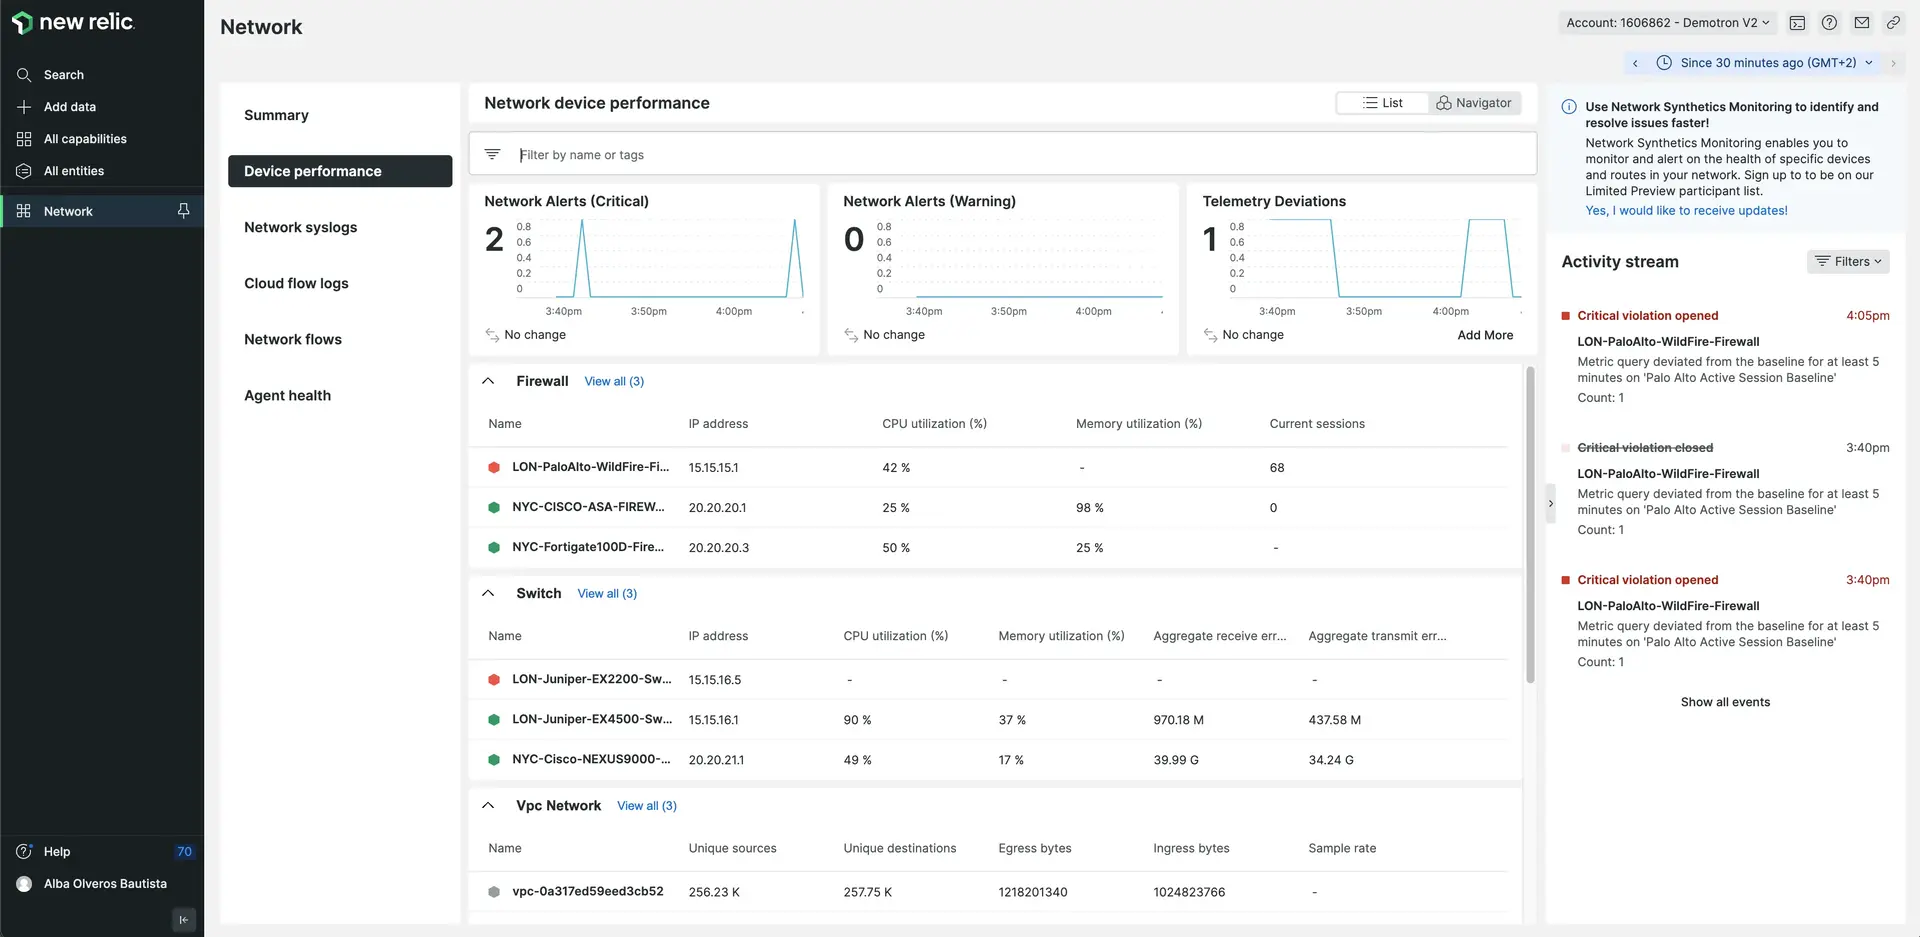
Available dashboards in network monitoring.
Network monitoring adds the context of network data to the application and infrastructure data you already collect in New Relic. By monitoring your network data, you can:
- Analyze and understand the performance of your entire stack (application and infrastructure) for a holistic understanding of your system performance.
- Have all the data in a single platform to eliminate blind spots.
- See at first glance whether a network is implicated in an issue.
Types of network data
You can monitor the following types of network data:
- Device performance via SNMP: Simple Network Management Protocol (SNMP) is an application–layer protocol for exchanging management information between network devices. To send SNMP data to New Relic, set up SNMP data monitoring.
- Network syslogs: It provides insights into what changed, errors, and other device events to quick understand the 'Why?' behind performance telemetry changes. To send network syslog data to, set up network syslog monitoring.
- Cloud flow logs: It details communications between hosts and other services by capturing source and destination IP address and port, metadata that describes both endpoints, key network performance telemetry, and the state of a specific communication attempt. Set up cloud flow log monitoring.
- Network flow logs: It captures information about the IP traffic going to and from network interfaces in your on-premises network. To send network flow data to New Relic, set up network flow data monitoring.
Important
We recommend configuring both SNMP and network flow data for better visibility into your network. This will provide both performance metrics and traffic patterns to troubleshoot and optimize your network.
High level architecture overview
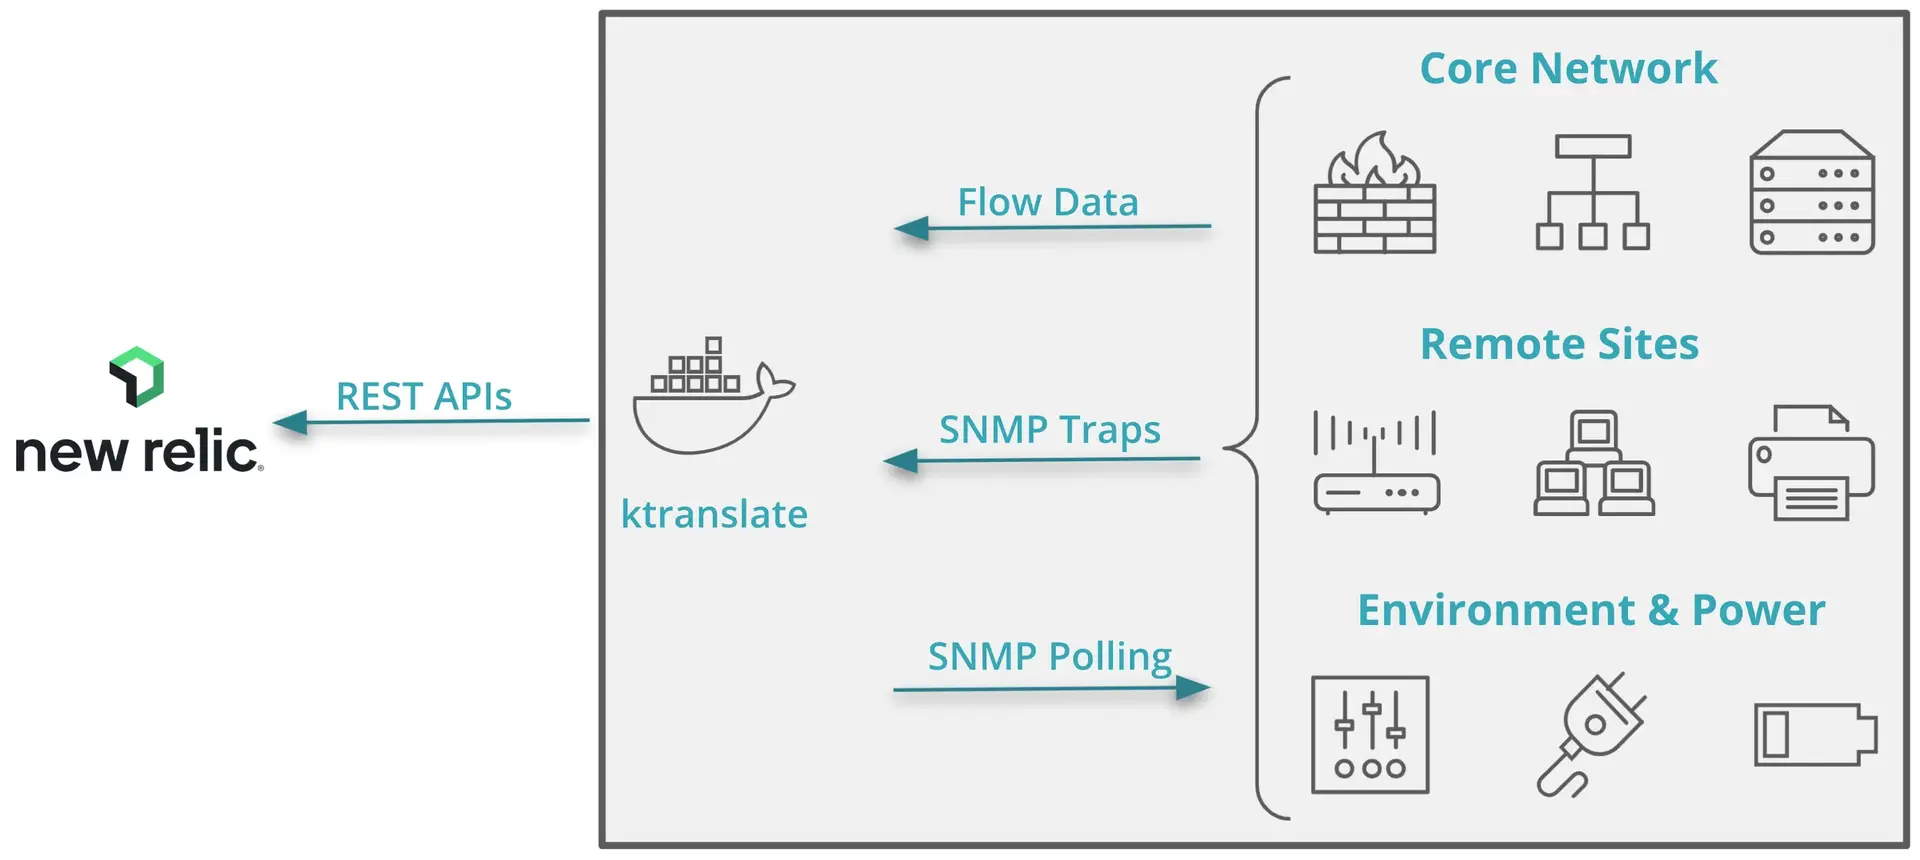
Our solution is based on the ktranslate docker container developed by our partner, Kentik. This single container image is hosted in your environment to collect and process your data to be exported to the Event, Metric, and Log APIs and displayed in New Relic.

Overview of network monitoring architecture.