• EnglishEspañol日本語한국어Português
  • Log inStart now

Find and use your Kubernetes data

You can build your own charts and query all your Kubernetes integration data using the query builder and the NerdGraph API. Our integration collects Kubernetes data by instrumenting the container orchestration layer. For a simpler and more visual experience, use the cluster explorer.
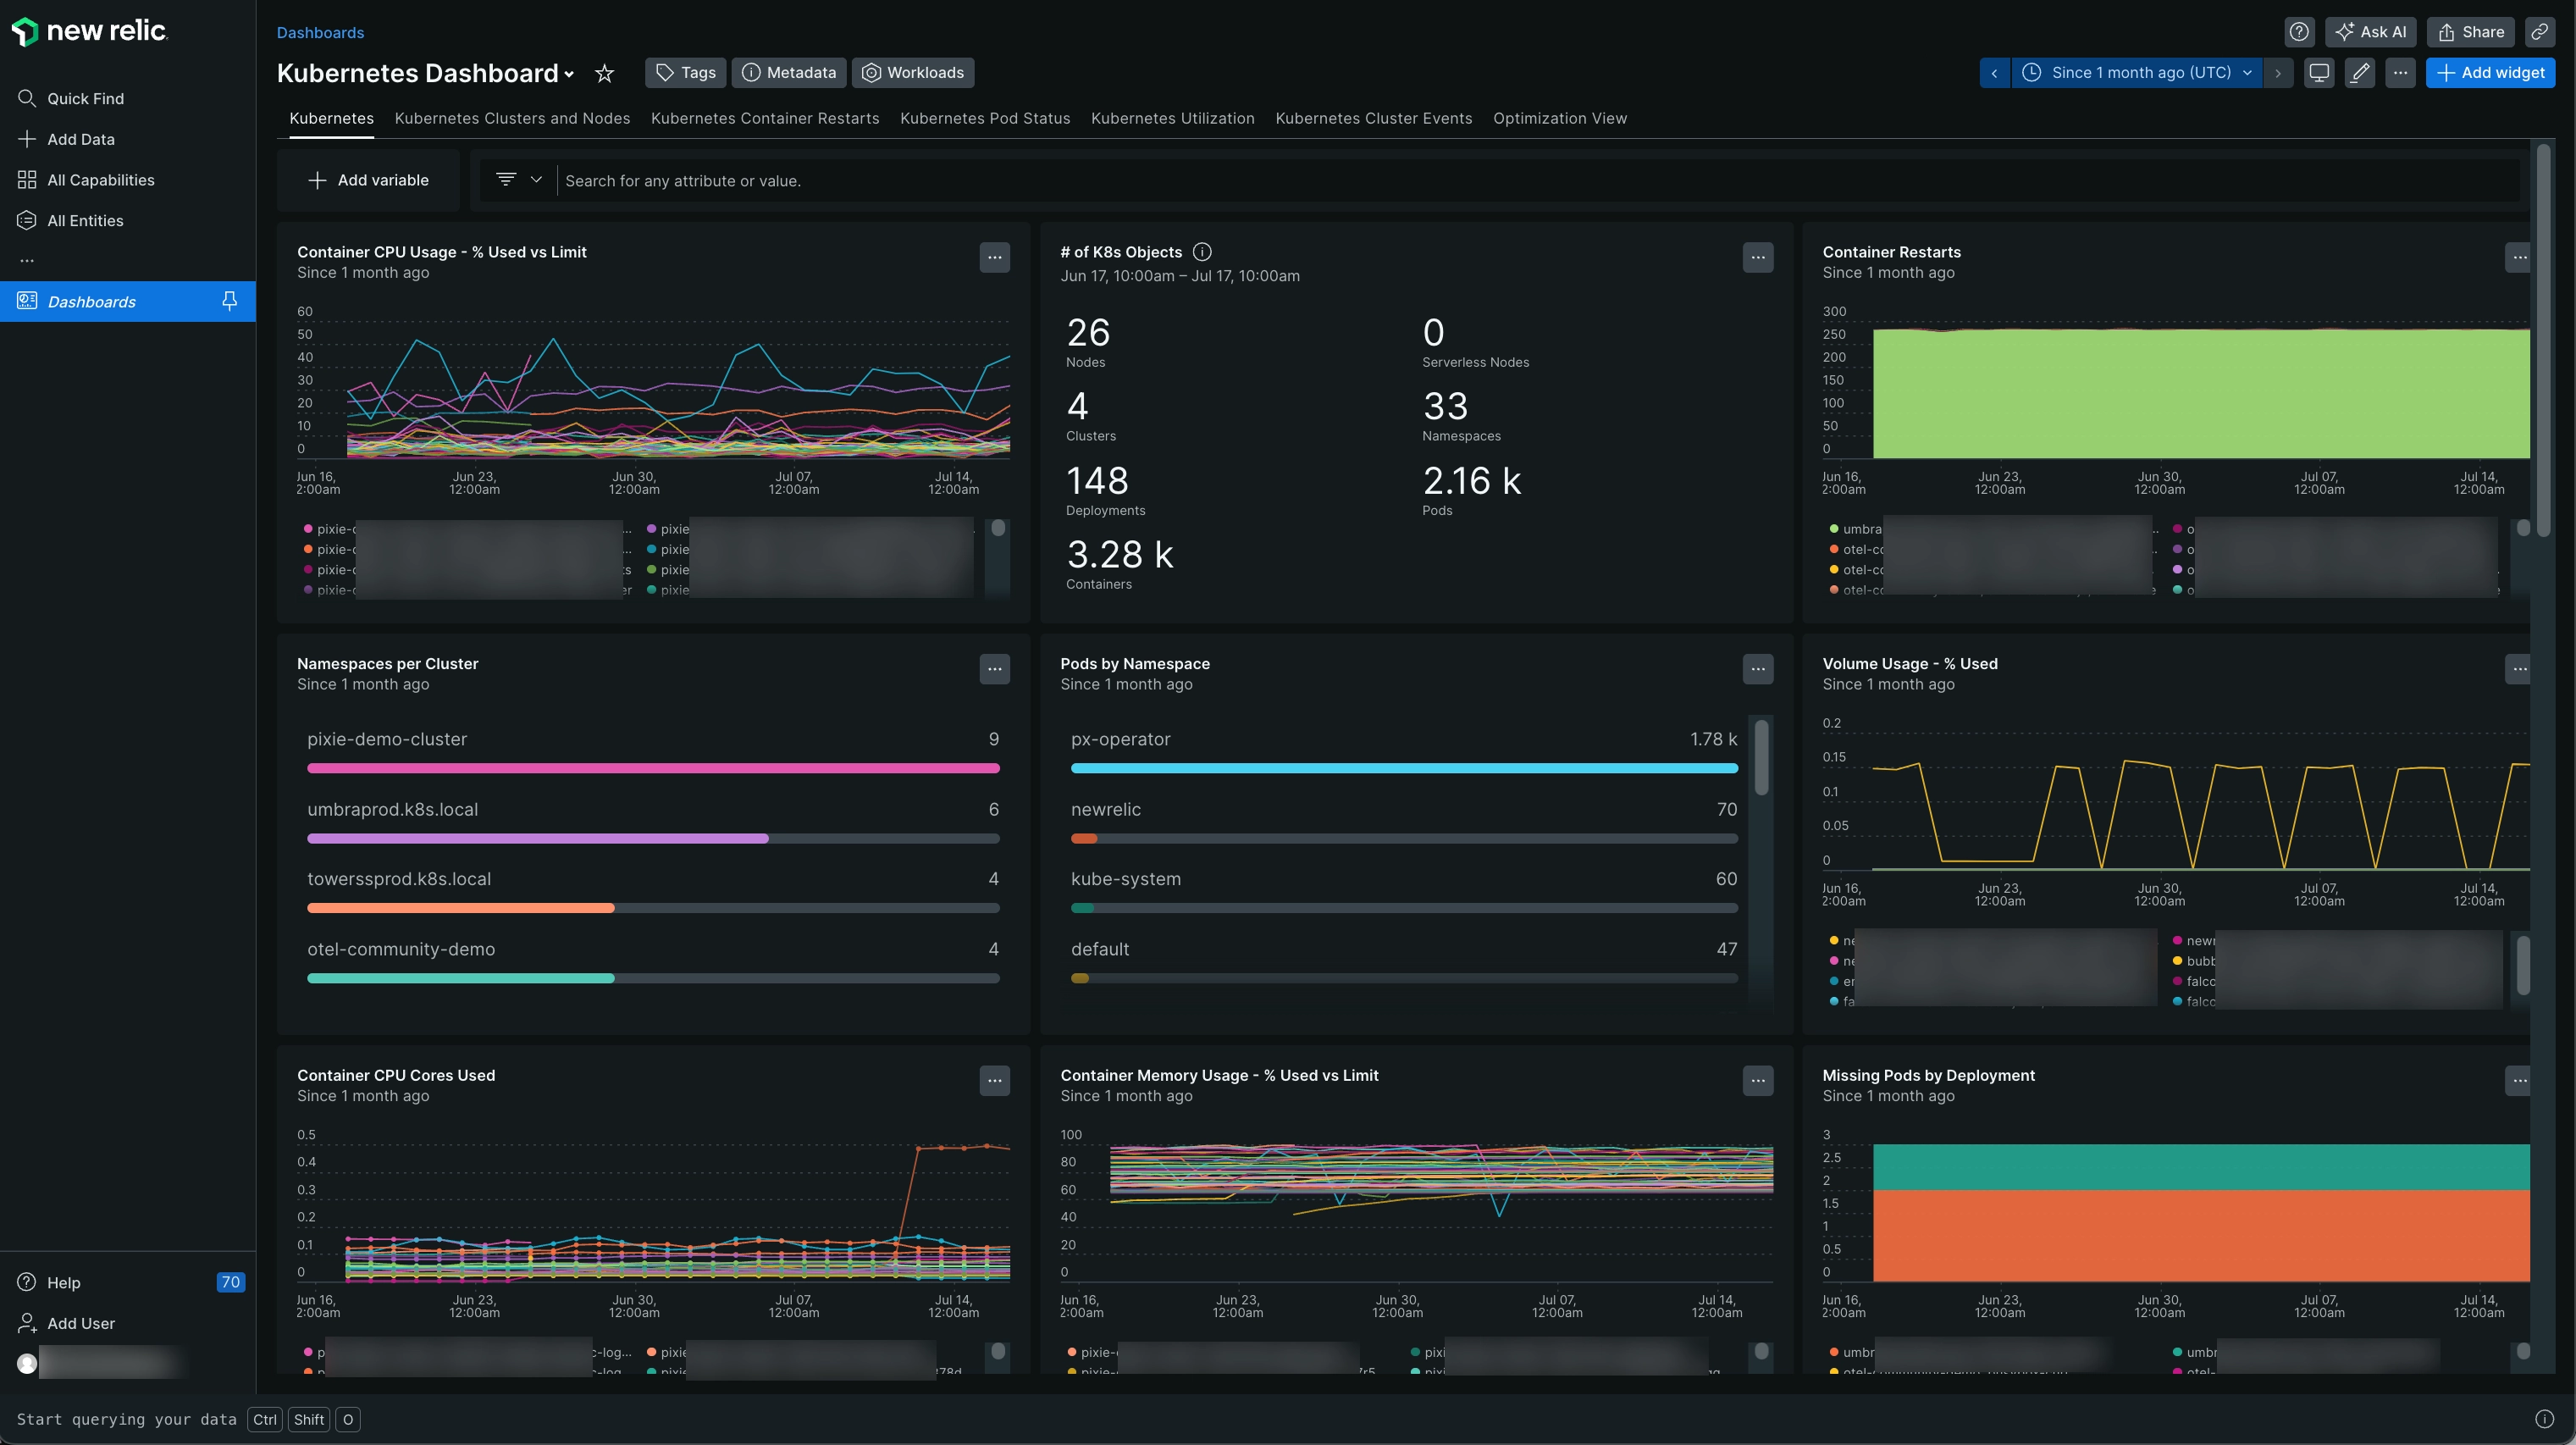
one.newrelic.com > All capabilities > Dashboards: Using the query builder you can query your Kubernetes data and create clear visualizations.

Query Kubernetes data

The simplest way to query your Kubernetes data is using the query builder, which accepts NRQL queries. Alternatively, you can use the NerdGraph API to retrieve Kubernetes data.

Events and attributes

Kubernetes data is attached to the following events. You can learn more about this data in our data dictionary.

Event name

Type of Kubernetes data

Available since

K8sNodeSample

Node data

v1.0.0

K8sNamespaceSample

Namespace data

v1.0.0

K8sDeploymentSample

Deployment data

v1.0.0

K8sReplicasetSample

ReplicaSet data

v1.0.0

K8sDaemonsetSample

DaemonSet data

v1.13.0

K8sStatefulsetSample

StatefulSet data

v1.13.0

K8sPodSample

Pod data

v1.0.0

K8sClusterSample

Cluster data

v1.0.0

K8sContainerSample

Container data

v1.0.0

K8sVolumeSample

Volume data

v1.0.0

K8sApiServerSample

API server data

v1.11.0

K8sControllerManagerSample

Controller manager data

v1.11.0

K8sSchedulerSample

Scheduler data

v1.11.0

K8sEtcdSample

etcd data

v1.11.0

K8sEndpointSample

Endpoint data

v1.13.0

K8sServiceSample

Service data

v1.13.0

K8sHpaSample

Horizontal Pod Autoscaler data

v2.3.0

K8sCronjobSample

CronJob data

v3.10.0

K8sJobSample

Job data

v3.10.0

To learn more about these events and their attributes, see our data dictionary.

Kubernetes metadata in APM-monitored applications

By linking your applications with Kubernetes, the following attributes are added to application trace and distributed trace:

  • nodeName
  • containerName
  • podName
  • clusterName
  • deploymentName
  • namespaceName

Manage alerts

You can be notified about and incidents for your Kubernetes data:

Reduce data ingest

Our charts support setting an option to reduce the amount of data ingested at the cost of granularity. To enable it, set global.lowDataMode to true in the nri-bundle chart.

lowDataMode affects four specific components of the nri-bundle chart outlined below.

New Relic Infrastructure

If lowDataMode is enabled, the default scrape interval changes from 15s to 30s. You can also specify a custom value for it using config.interval, which will take preference over lowDataMode.

Prometheus Agent Integration

If lowDataMode is enabled, the metrics that are prefixed with the following are excluded by default as they're already collected and used by the New Relic Kubernetes Integration.

- kube_
- container_
- machine_
- cadvisor_

New Relic Logging

If lowDataMode is enabled, Labels and Annotations are not included in the logs forwarded to New Relic. This reduces the overall data ingest into New Relic.

The following fields are retained: cluster_name, container_name, namespace_name, pod_name, stream, message and log.

Low Data Mode Log Example

The following log record contains all the attributes typically captured by the New Relic Logs Kubernetes plugin:

[
{
"cluster_name": "api-test",
"kubernetes": {
"annotations": {
"kubernetes.io/psp": "eks.privileged"
},
"container_hash": "fryckbos/test@sha256:5b098eaf3c7d5b3585eb10cebee63665b6208bea31ef31a3f0856c5ffdda644b",
"container_image": "fryckbos/test:latest",
"container_name": "newrelic-logging",
"docker_id": "134e1daf63761baa15e035b08b7aea04518a0f0e50af4215131a50c6a379a072",
"host": "ip-192-168-17-123.ec2.internal",
"labels": {
"app": "newrelic-logging",
"app.kubernetes.io/name": "newrelic-logging",
"controller-revision-hash": "84db95db86",
"pod-template-generation": "1",
"release": "nri-bundle"
},
"namespace_name": "nrlogs",
"pod_id": "54556e3e-719c-46b5-af69-020b75d69bf1",
"pod_name": "nri-bundle-newrelic-logging-jxnbj"
},
"message": "[2021/09/14 12:30:49] [ info] [engine] started (pid=1)\n",
"plugin": {
"source": "kubernetes",
"type": "fluent-bit",
"version": "1.8.1"
},
"stream": "stderr",
"time": "2021-09-14T12:30:49.138824971Z",
"timestamp": 1631622649138
}
]

This is how the previous log record would look like after enabling lowDataMode:

[
{
"cluster_name": "api-test",
"container_name": "newrelic-logging",
"namespace_name": "nrlogs",
"pod_name": "nri-bundle-newrelic-logging-jxnbj",
"message": "[2021/09/14 12:30:49] [ info] [engine] started (pid=1)\n",
"stream": "stderr",
"timestamp": 1631622649138
}
]

New Relic Pixie Integration

If lowDataMode is enabled, the newrelic-pixie integration performs heavier sampling on Pixie spans and reduces the collection interval from 10 seconds to 15 seconds.

lowDataMode settings:

HTTP_SPAN_LIMIT: 750
DB_SPAN_LIMIT: 250
COLLECT_INTERVAL_SEC: 15

The default settings for these parameters and others can be found in the newrelic-pixie-integration Github repo.

To take full advantage of New Relic's kubernetes integration, you'll need a free New Relic account. If you haven't already, create yours below to start monitoring your data today.

Copyright © 2024 New Relic Inc.

This site is protected by reCAPTCHA and the Google Privacy Policy and Terms of Service apply.