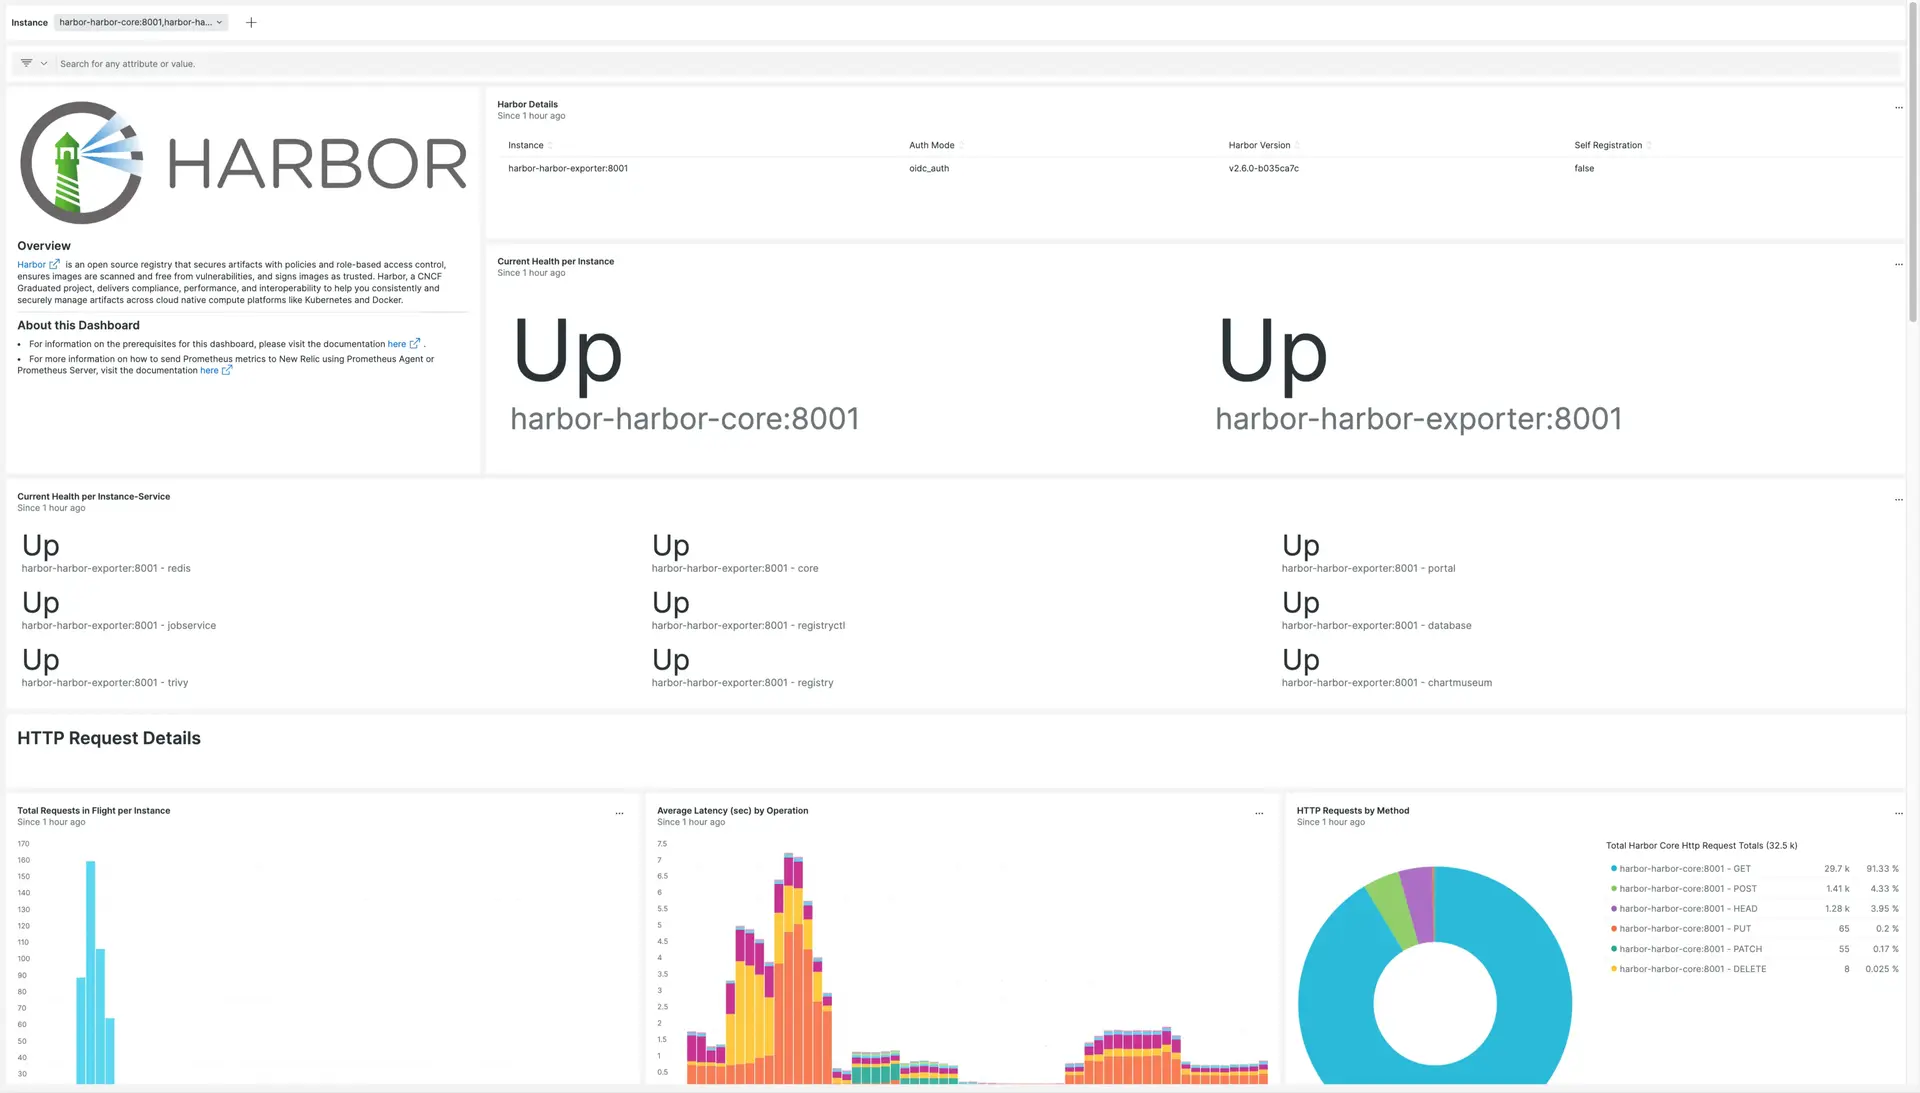
Harbor is an open-source registry that secures artifacts with policies and role-based access control, ensures images are scanned and free from vulnerabilities, and signs images as trusted. Harbor, a CNCF Graduated project, delivers compliance, performance, and interoperability to help you consistently and securely manage artifacts across cloud native compute platforms like Kubernetes and Docker.
Use New Relic to view a dashboard based on Prometheus metrics which helps you understand the Harbor infrastructure of your k8s cluster. With New Relic you can monitor:
- Harbor service status
- Harbor Project byte quota utilization percentage
- Harbor Server and Client error rates

Enable the integration
Follow these steps to enable the integration.
Follow the Harbor documentation for Prometheus to discover the Harbor metrics endpoints.
Set up Prometheus monitoring. Prometheus metrics needs to be integrated with New Relic, you can use the Prometheus Agent or the Remote Write integration. See how to send Prometheus metrics for more details.
Important
The Prometheus Agent only scrapes metrics by default from a set of integrations.
In this case, you must identify your pod or endpoint with one of the these labels
app.kubernetes.io/name,app.newrelic.io/name,k8s-appcontaining the stringharbor.Use the following query to confirm metrics are being ingested as expected:
FROM Metric SELECT count(*) WHERE metricName LIKE 'harbor_%' FACET metricName LIMIT MAXInstall the Harbor quickstart to access built-in dashboards and alerts.
Once imported, you can edit or clone the assets to adapt them to your specific requirements.
Important
Some charts of the dashboard include queries with conditions that require the identification of your pod or endpoint with one of the these labels
app.kubernetes.io/name,app.newrelic.io/name,k8s-appcontaining the stringharbor.
Find and use metrics
Prometheus metrics are stored as dimensional metrics. You can query using NRQL or use the Data Explorer to browse the available metrics, facet, and filter by the associated dimensions.
The different sets of metrics exposed by this integration are defined in the Harbor documentation.
Use the following NRQL queries to understand the metrics being ingested in New Relic:
List unique metric names:
FROM Metric SELECT keysetlike('harbor_%')Count number of metric updates:
FROM Metric SELECT datapointcount() WHERE metricName LIKE 'harbor_%' LIMIT MAXEstimate data ingestion (daily ingest, in bytes):
FROM Metric SELECT bytecountestimate() FACET metricName WHERE metricName LIKE 'harbor_%' SINCE 1 DAY AGO LIMIT MAX
Troubleshooting
Use this command to verify that the Harbor Prometheus endpoint is emitting metrics on any K8s node configured with Harbor:
bash$curl <Harbor-Pod-IP>:9090/metricsYou can also check the specific troubleshooting guidelines for Prometheus integrations.