New Relic's Prometheus agent is a thin wrapper on top of Prometheus server to run it in agent mode. With this integration, you can create a YAML configuration file used by Prometheus that's ready to send metrics to New Relic.
Learn more about the solution from its repository.
Install the Prometheus agent
You can install the Prometheus agent either as part of the Kubernetes integration or on its own.
Alongside the Kubernetes integration
You can install our Kubernetes integration to get a full observability of your Kubernetes clusters, which includes the Prometheus agent.
Install our Kubernetes integration. See how to install it here.
Tip
We also offer manual instructions for deploying our integration using Helm.
You need to enable the Prometheus agent by setting the
newrelic-prometheus-agent.enabled=trueoption.To ensure the integration has been configured correctly, go to one.newrelic.com > All capabilities > Query your data, and run this NRQL query to see if data has been reported:
FROM Metric SELECT count(*) WHERE collector.name = 'prometheus-agent'AND cluster_name = 'YOUR_CLUSTER_NAME' SINCE 1 hour ago
Tip
If you don't see your data right away, wait for a few seconds. Data may take some time to make it to New Relic.
Standalone installation
If you don't need the Kubernetes integration, you can install the Prometheus agent on its own.
Install the Prometheus Agent by running:
bash$helm repo add newrelic-prometheus https://newrelic.github.io/newrelic-prometheus-configurator$helm upgrade --install newrelic newrelic-prometheus/newrelic-prometheus-agent -f YOUR_CUSTOM_VALUES.yamlTo ensure the integration has been configured correctly, go to one.newrelic.com > All capabilities > Query your data, and run this NRQL query to see if data has been reported:
FROM Metric SELECT count(*) WHERE collector.name = 'prometheus-agent'SINCE 1 hour ago
Install the Prometheus agent dashboard
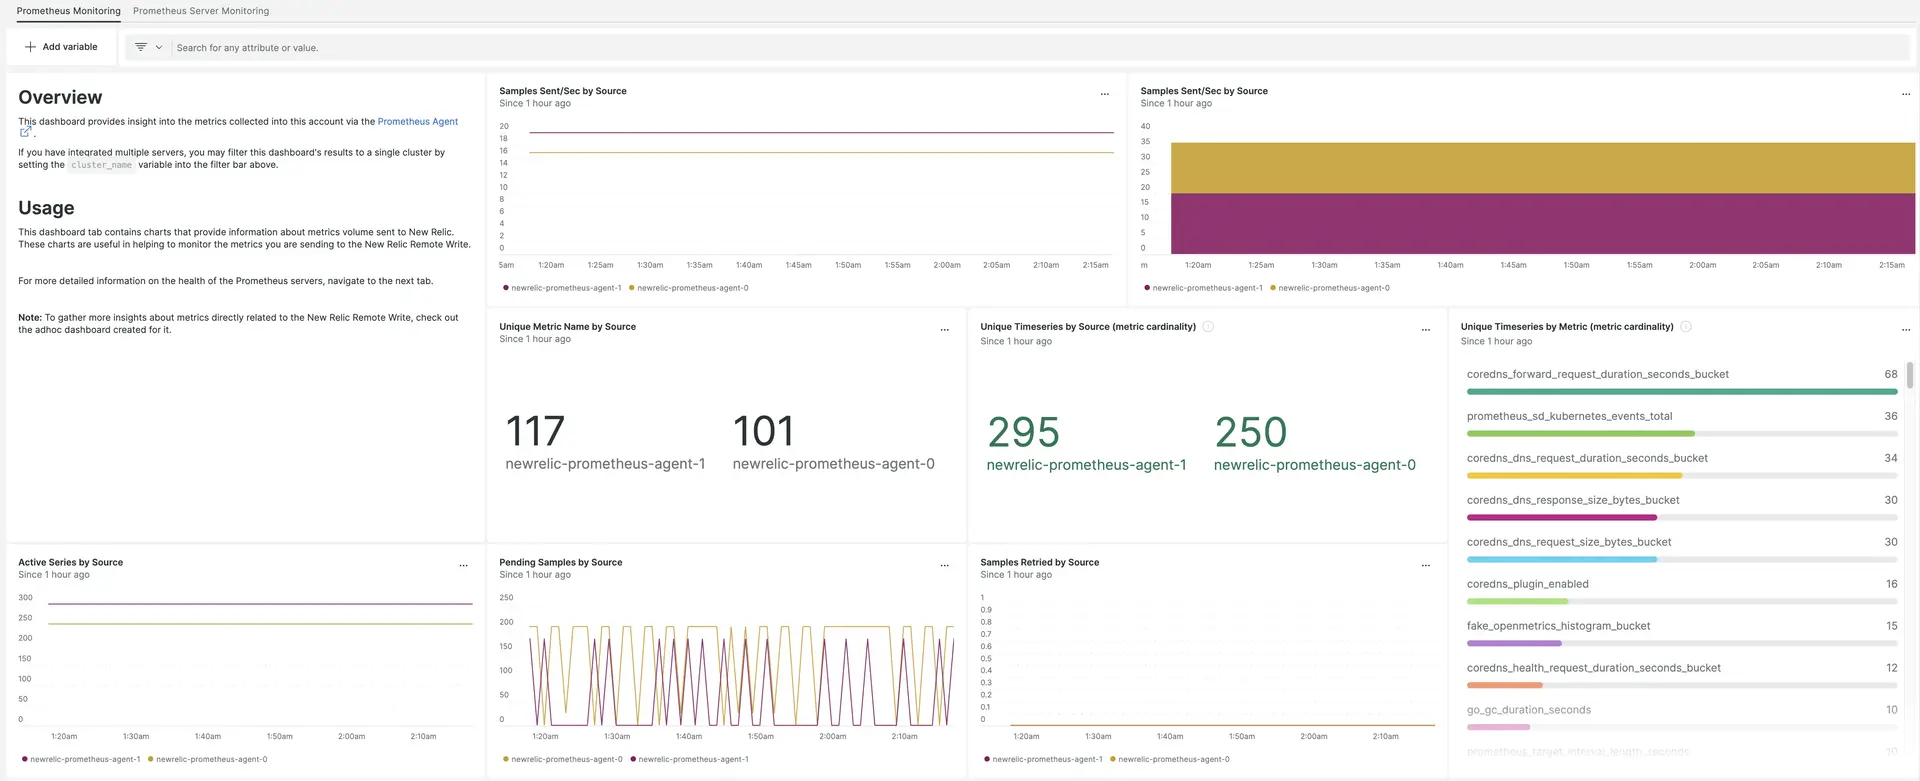
Regardless of whether you installed the Kubernetes integration or only the Prometheus agent, we also give you a curated dashboard for self-metrics with performance and health information, and also metrics volume sent.
With this dashboard, you get meaningful insights about your Prometheus metrics and your Prometheus agent, such as:
- Samples sent by Source
- Unique metrics by Source
- Time series by Source
- Time series by Metric (Cardinality)
- Memory and CPU consumption
- Targets Failed to scrape
- Total Instances by cluster
Install the dashboard for the Prometheus agent in your New Relic account.

Install the quickstart containing the dashboard for the Prometheus agent.