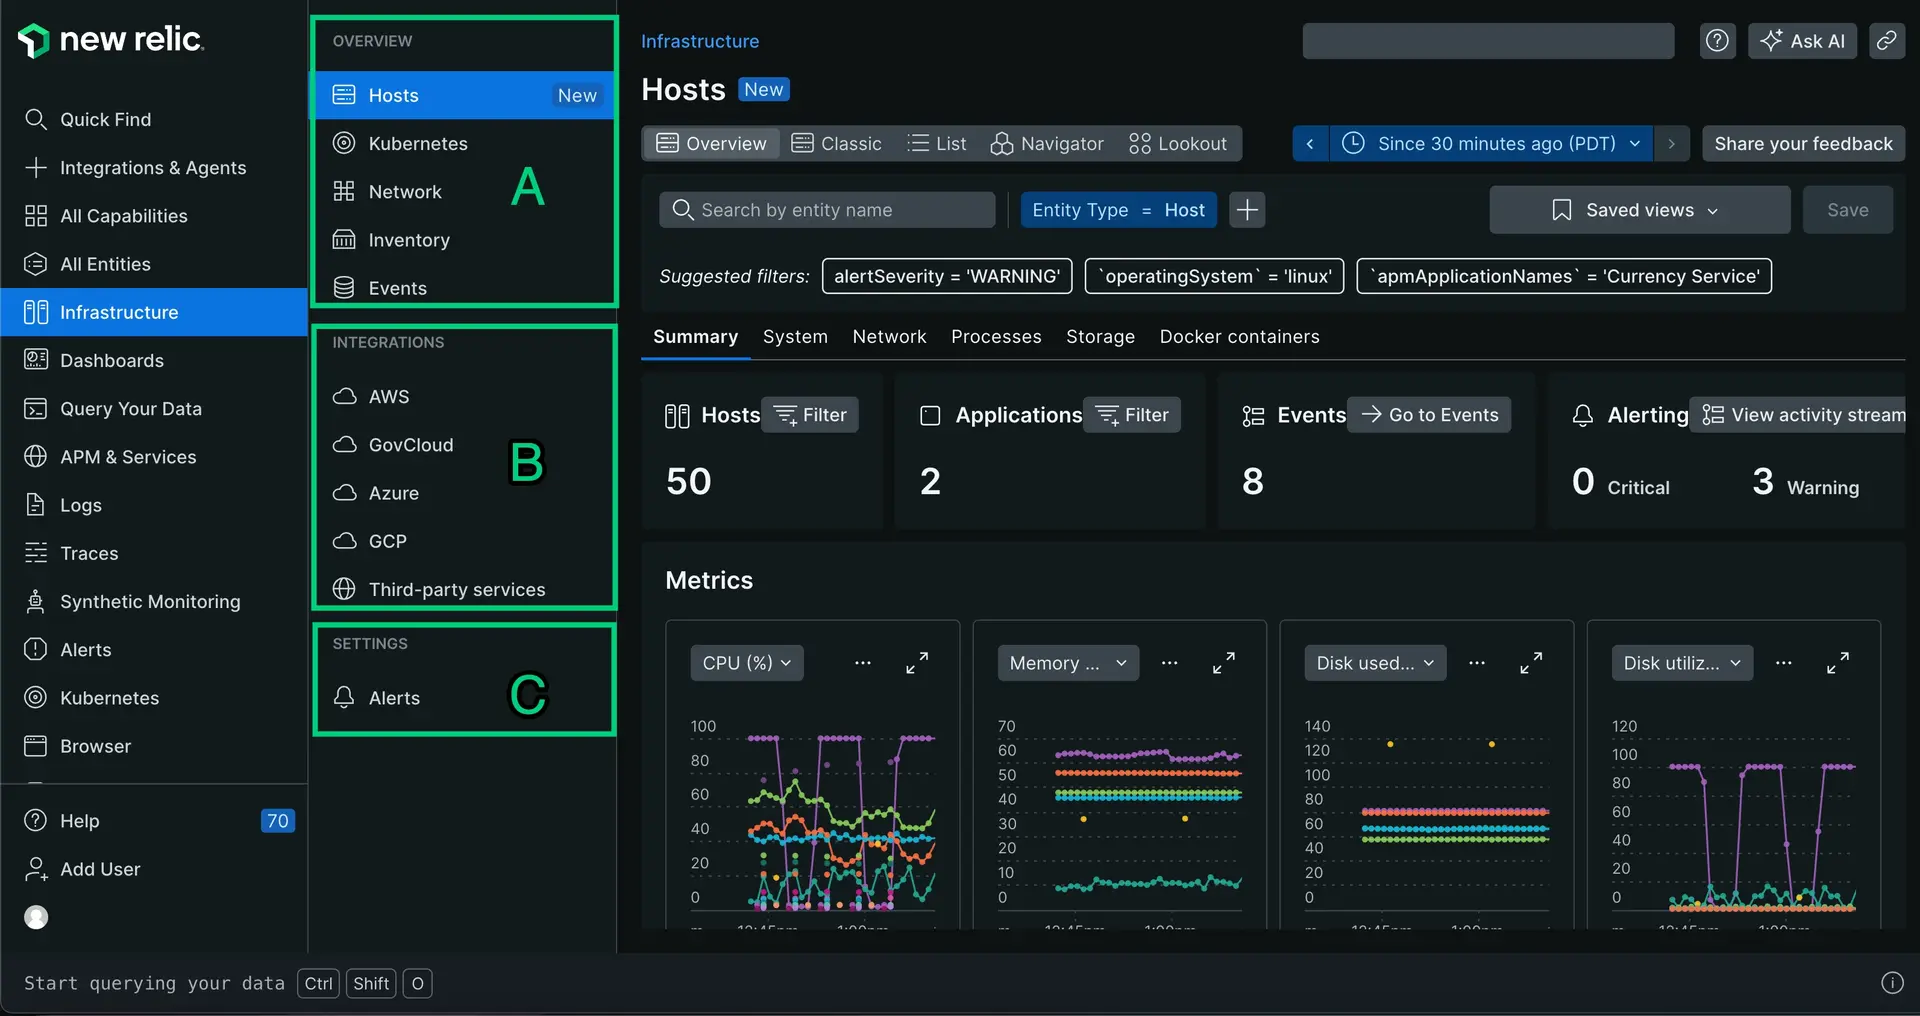
Our Infrastructure UI helps you efficiently understand the state of your infrastructure. We'll give you a summary of the main parts of the infrastructure UI.

one.newrelic.com > All capabilities > Infrastructure
A: Overview
When you open the infrastructure UI, you start out on the Hosts page, which gives you an overview of the state of your system, and gives you many options for exploring your hosts in more detail.
Other pages in the Overview section include:
- Kubernetes: This data is reported by our Kubernetes integration, if enabled.
- Network: This takes you to our network performance monitoring UI.
- Inventory: Here you can check your infrastructure configuration for upgrades and configuration drift. Learn more about the inventory UI.
- Events: A timeline of important system activity in your infrastructure stack. Learn more about the events UI.
B: Integrations
The Integration section of the UI includes telemetry from any infrastructure integrations you've set up. These integrations can include:
- Cloud service integrations, including AWS, Azure, and Google Cloud Platform
- Third-party services: our many infrastructure-related integrations, including Apache, Cassandra, StatsD, RabbitMQ, and many more. To browse and add these, go to the Integrations & Agents page in the platform.
C: Settings
The Settings section of the UI helps you understand:
- Agents: See details about the infrastructure agents installed in your system.
- Alerts: See an overview of in your system, with a focus on active alert events. Learn more about infrastructure alerting.