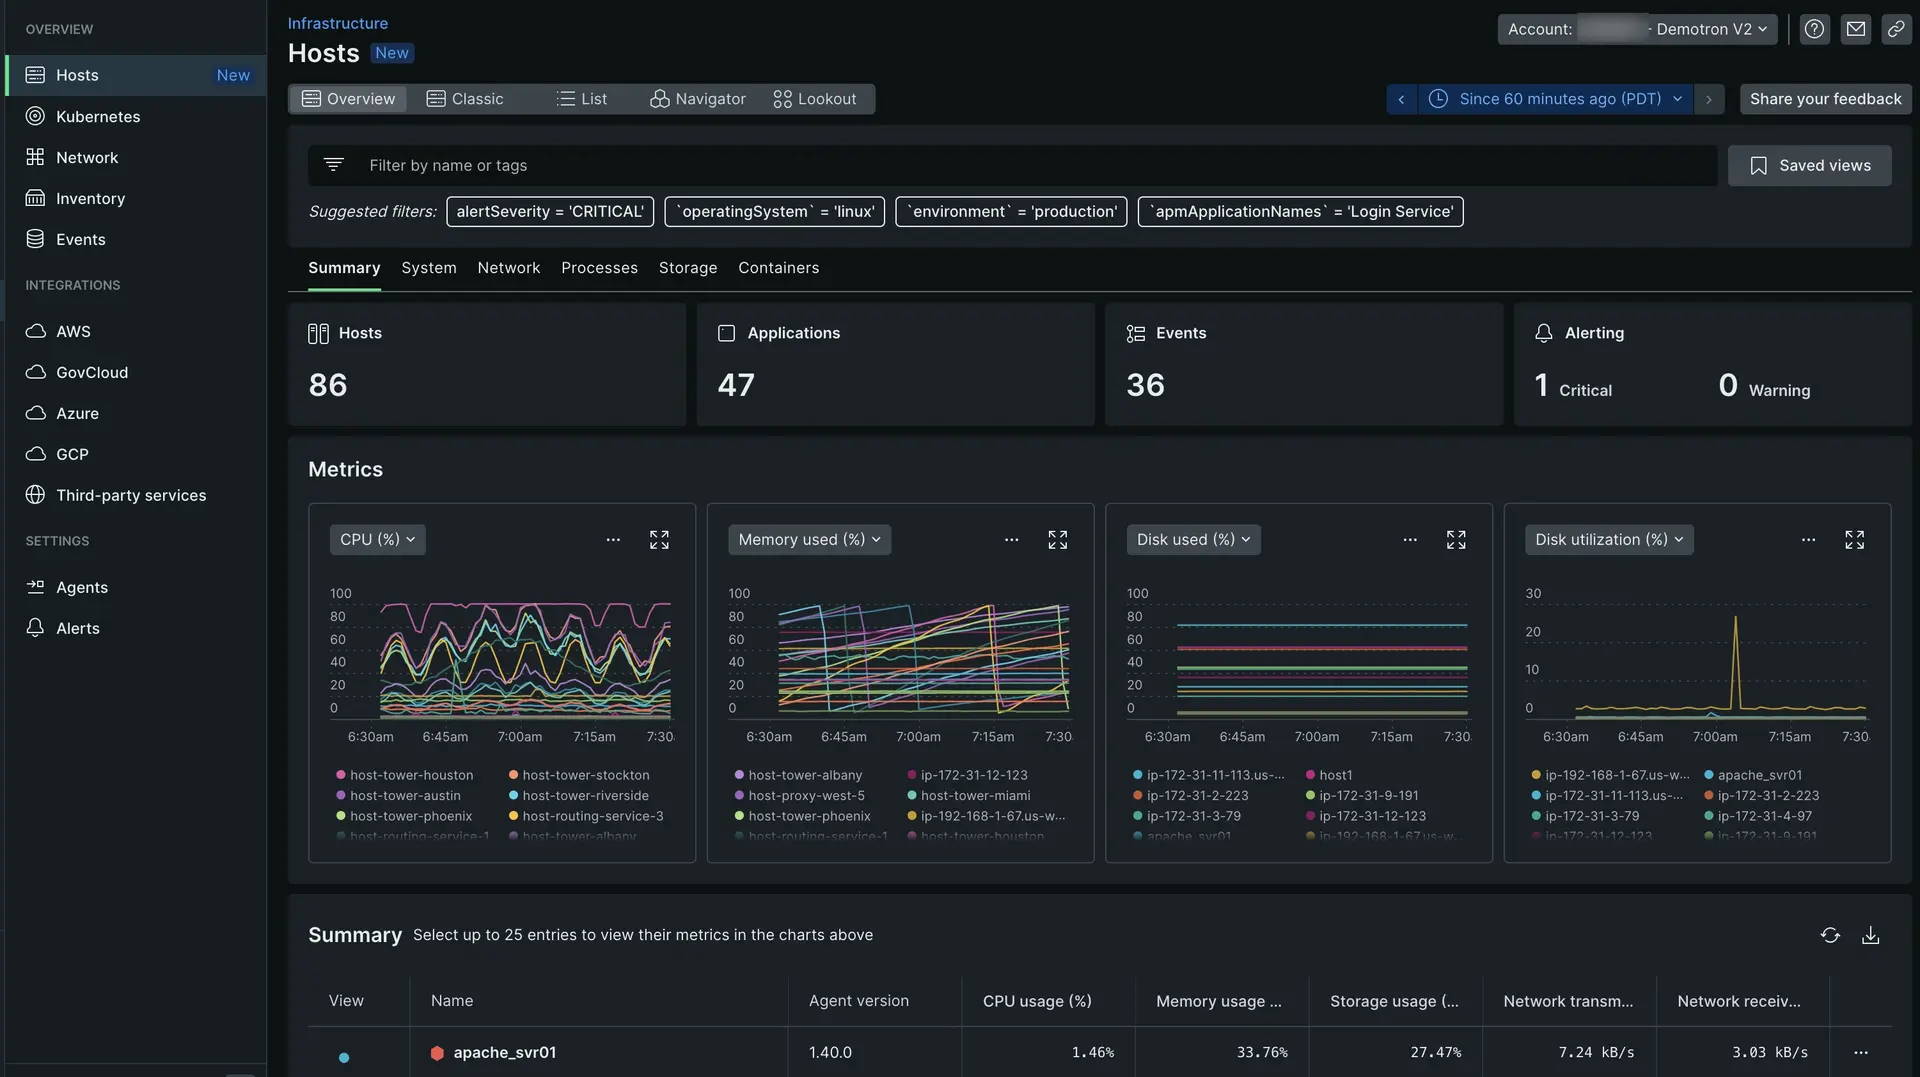
In our infrastructure monitoring UI, the Hosts UI page is the main place for you to understand and troubleshoot issues with your infrastructure.
Tip
These docs describe the new Hosts UI added in April of 2023. You can switch between the new view and the Classic view.

one.newrelic.com > All capabilities > Infrastructure
An example use case
The Hosts page is the place to go to investigate issues in your infrastructure. Here's one example of a common workflow our customers use to diagnose a problem:
- On the APM summary page, you notice an issue with your Kafka service. Throughput has dropped and many errors are present.
- Based on the infrastructure data you see in APM, you think it's a host issue so you click through to the infrastructure Hosts page.
- The Hosts page automatically filters to your Kafka service. You see that half of the hosts running that service have maxed out their CPU %.
- If you suspect a host configuration change could be the source of your issue, go to the Inventory tab and check your system's configurations per host.
UI features for exploring and analyzing your hosts
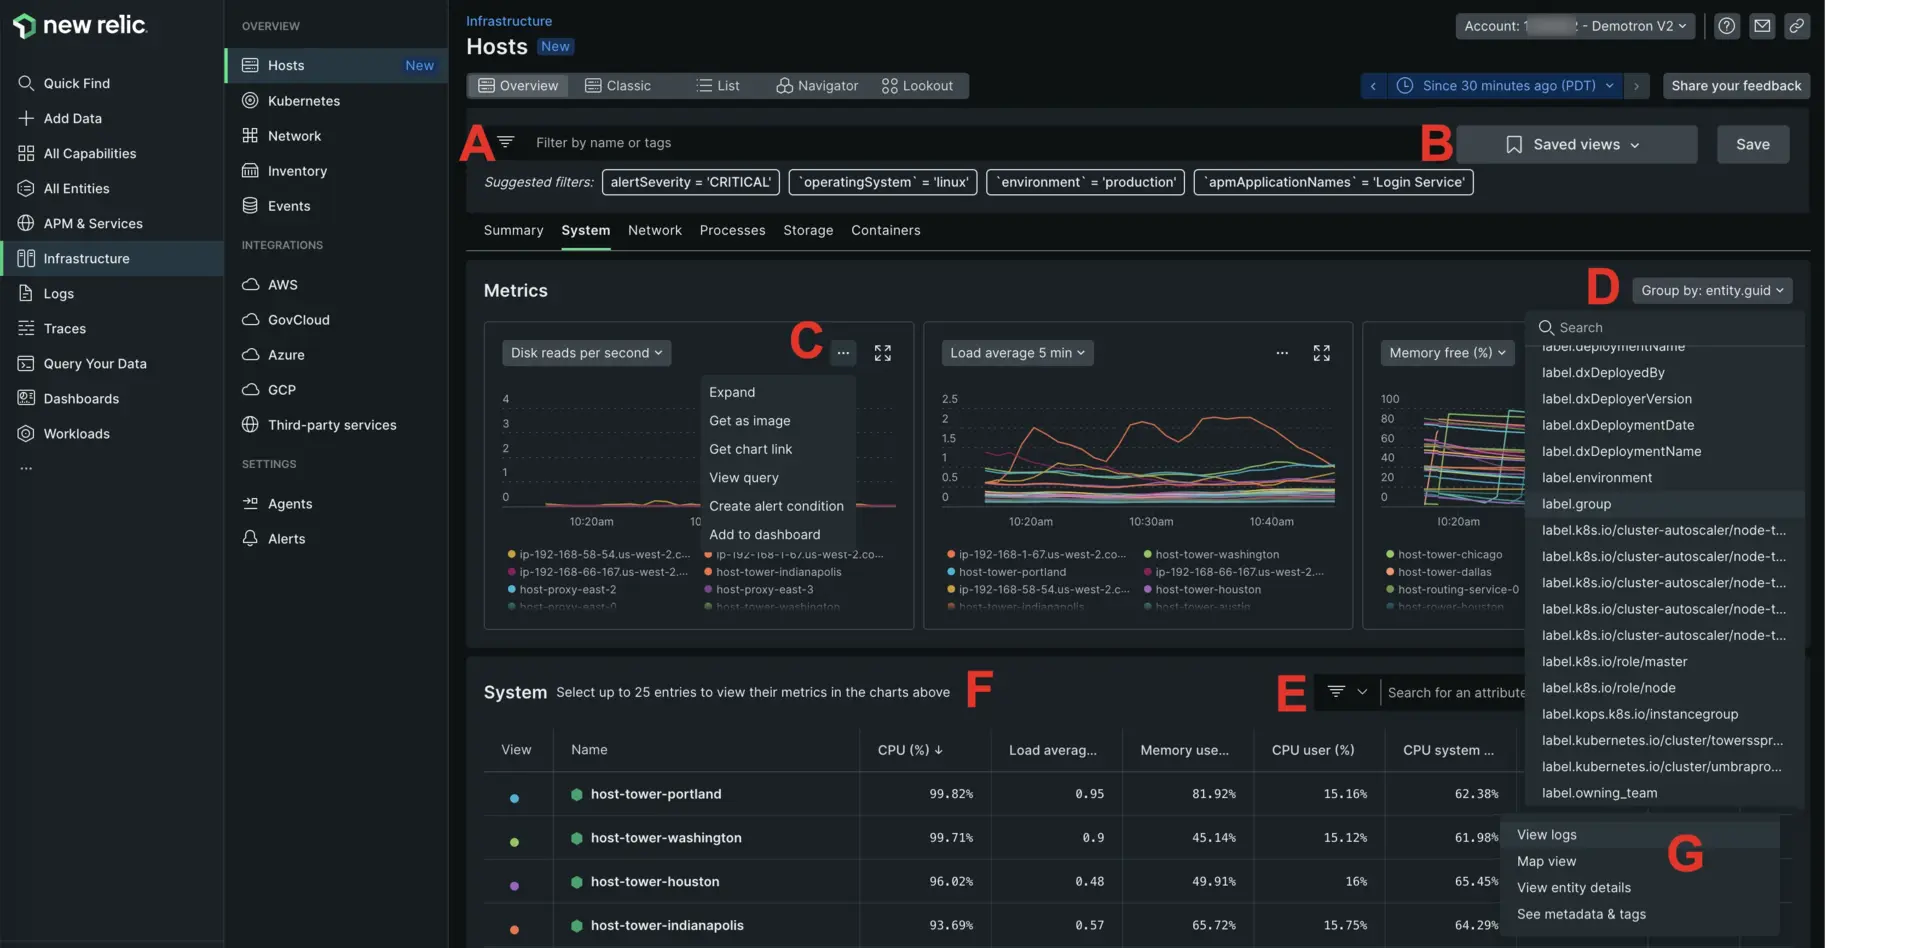
There are some important UI features available across the Hosts UI. Understanding how to use these will help you get the most out of this UI.

- A. The filter bar: Filter for the hosts you want to see. For tips, see Filter bar.
- B. Saved views: When you create a view you like (which can include filters, and custom chart and table selections), click Save.
- C. Chart options: You can switch to different metrics for each chart, and you can click
...to see more chart options, including getting a shareable link and creating an alert for that metric. - D. Group by: Use this to group chart results by specific attributes. For example, you might display the AWS regions with the highest CPU usage grouped by
awsRegion. - E. Attribute filter: This lets you filter your hosts to those with a specific attribute value. For example,
- F. Host table: By default, 25 hosts are selected for display. Use the table columns and the attribute filter to explore the hosts, and select different hosts for display. You can export the table as a CSV.
- G. Host details: For a specific host in the host table, click the icon to see more options to learn about it, including options for viewing logs, seeing an entity map, and more.
Tabs on the hosts UI page
Here are more details about the tabs available on the Hosts UI page:
Infrastructure data
To learn more about infrastructure data, see Infrastructure data.


