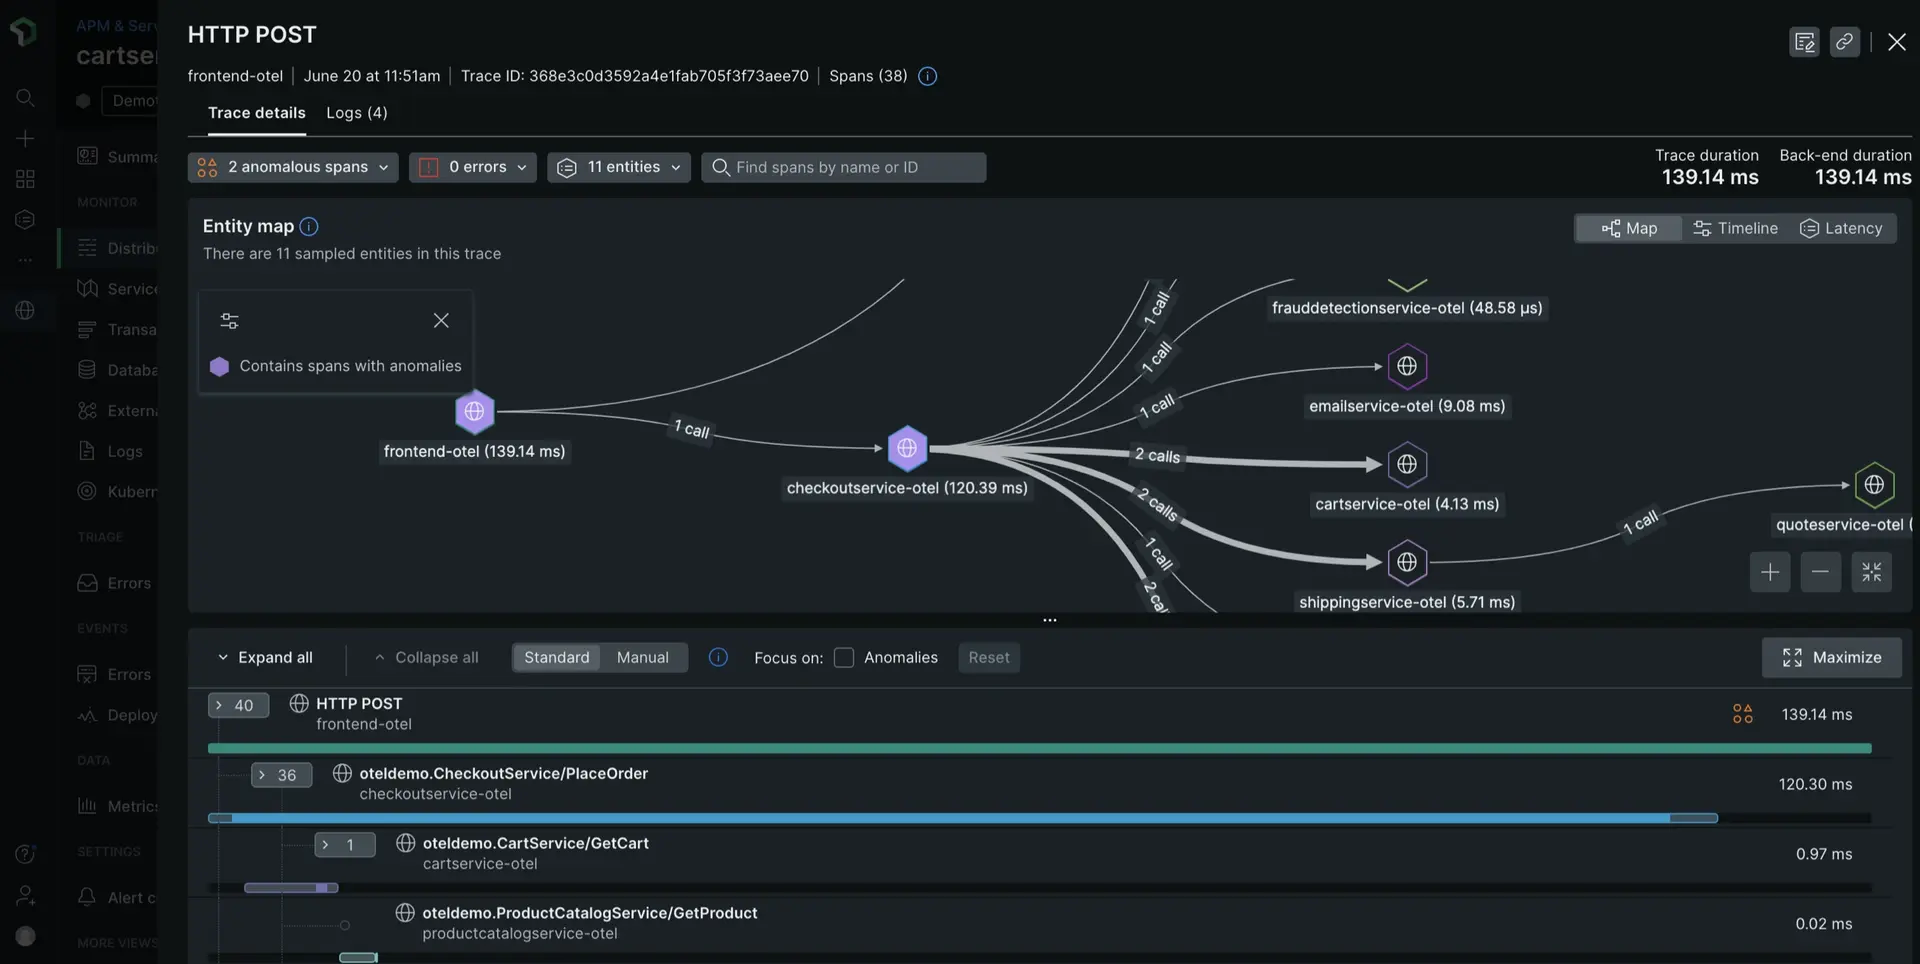
We recommend you review our docs on sampling types before you get started to determine if you'd like to use standard distributed tracing or Infinite Tracing. Also, if you are currently using New Relic agents and would like to enable distributed tracing, see our planning guide.
To set up distributed tracing, you'll complete three general steps:

Identify services: Identify and write down the endpoints, services, languages, and systems that are used to complete this request (you'll need this information in the next step). If you have an environment diagram like the following, you could use it to create a list of services handling requests:

Instrument services: Instrument each service you identify so it can send your trace data. Some tools, such as agents, instrument services automatically, while other tools require you to insert some code in the services. Click the icon below for instrumentation steps:
View traces: After you instrument the services, generate some traffic in your application, and then go to the New Relic UI to see your trace data.


