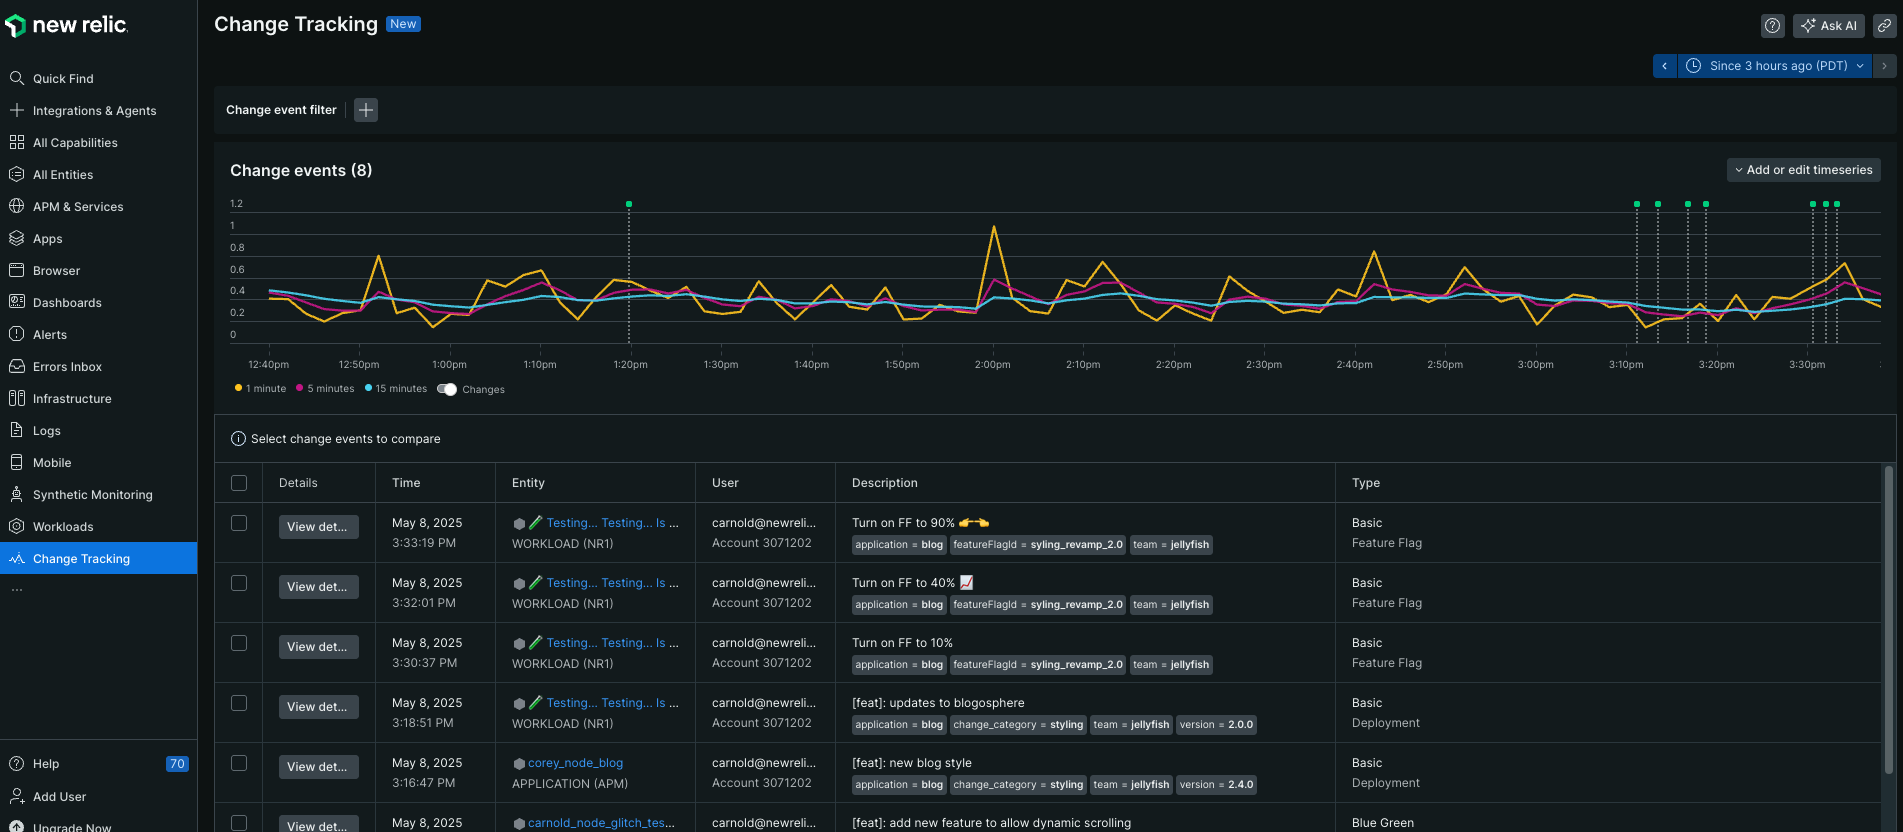
Modern applications change frequently through deployments, feature flags, configuration updates, and operational modifications. When performance issues occur, teams struggle to identify which of the recent changes caused the problem.
New Relic's change tracking captures and visualizes system modifications, helping you quickly correlate changes with performance impacts and resolve issues faster.

Why use change tracking?
Change tracking helps you answer critical questions when issues arise:
- "What changed before this outage?" See a timeline of all modifications leading up to incidents
- "Did our deployment cause this regression?" Compare performance metrics before and after releases
- "Which feature flag toggle affected conversion rates?" Correlate business metrics with configuration changes
Use cases:
- Development teams correlate deployments with performance regressions
- Product teams analyze feature launch impact on user experience
- SRE teams track operational changes during incidents
Key features
- Universal change capture: Record any modification, feature flags, business events, operational changes, and custom activities
- Visual correlation: View interactive change markers overlaid on performance charts across APM, browser, mobile, and custom dashboards
- Any entity: Changes can be associated with any entity on the New Relic platform
- Advanced analysis: Access detailed impact analysis including error trends, anomaly detection, and comparative before/after metrics
- Rich metadata: Include context like commit SHAs, changelogs, user information, and custom attributes
- Unified data storage: All change data stored in NRDB for consistent querying with NRQL and NerdGraph
- Flexible integration: Configure via APIs, CLI, or CI/CD pipeline integrations such as GitHub Actions and Jenkins
How you can configure change tracking?
Setting up change tracking involves understanding requirements, choosing your tracking method, configuring integration, and analyzing the data:
Compatibility and requirements
Ensure your environment meets the requirements for change tracking:
- User permissions: Any user type can create change events and deployment markers via NerdGraph, but only full platform users can access the curated change tracking UI experiences
- Entity access: Ensure you have access to the entities (APM services, mobile apps, infrastructure hosts) where you want to track changes
Configure change tracking
Configure change tracking using the method that best fits your workflow:
Track changes for any system modification including deployments, feature flags, business events such as marketing campaigns and conventions, operational changes such as server reboots and maintenance, and custom activities. It provides flexible categorization, custom attributes, unified cross-account visibility, and advanced filtering capabilities. You can also dynamically associate an event with an entity using New Relic's embedded entity search, which eliminates the need to know the entity.guid.
You can configure change tracking events using one of the following methods:
- NerdGraph API: Create change events via GraphQL mutations
- New Relic CLI: Use CLI for quick setup
- GitHub Actions: Automate change events in CI/CD pipelines
You can configure change tracking deployments using one of the following methods:
- NerdGraph API: Record deployments via GraphQL mutations
- New Relic CLI: Command line deployment tracking
- Jenkins: Automated tracking with Jenkins plugin
- GitHub Actions: Configure deployment tracking in workflows
View and analyze your change data
After configuring change tracking, you can:
Access the unified interface to view all change events across entities and accounts, with filtering by team, type, custom attributes, and time correlation with metrics. For more information, refer to view and analyze your data.
Use NRQL and NerdGraph to build custom analysis and dashboards.
You can use webhooks to send change event notifications to your teams.
What's next
Set up using NerdGraph
Learn how to set up change tracking for your entities using NerdGraph to monitor them in New Relic.
Set up using CLI
Learn how to set up change tracking for your entities using CLI to monitor them in New Relic.
View and analyze changes
Learn advanced techniques for correlating change data with performance metrics and system behavior.