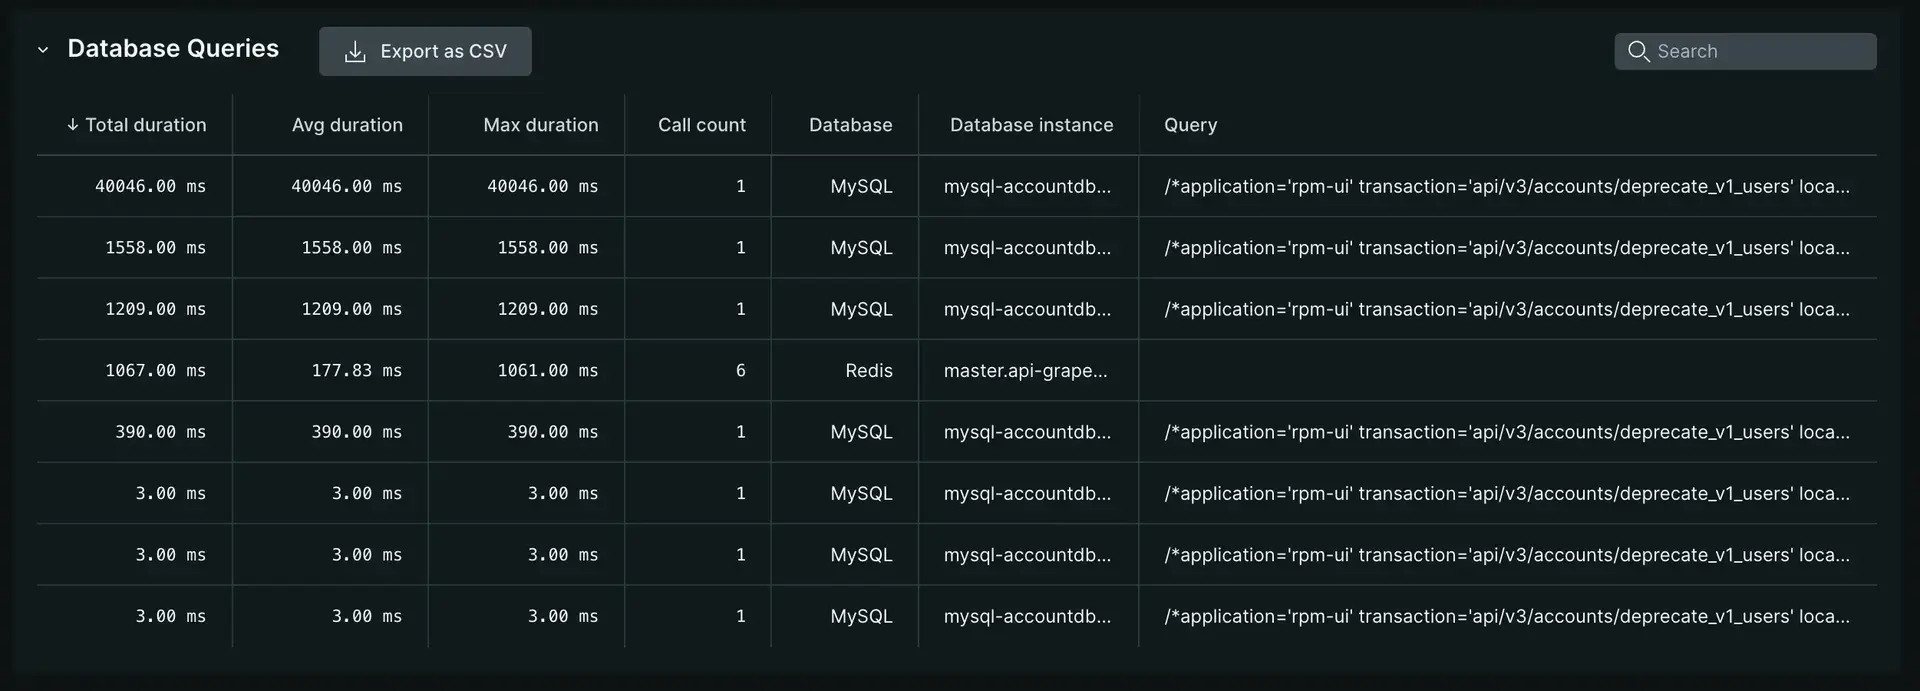
In APM, transaction traces can contain database query data. Use the Database queries page to analyze a slow transaction or change database query collection settings.
Find Database queries
If database query data is associated with your selected transaction trace, the Database queries page will be visible from the Transaction trace details page.
If you expect to see database data for a transaction trace but don't see it, you may need to change the Database query settings.

Go to one.newrelic.com > All capabilities > APM & services > (select an app) > Monitor > Transactions > (select a transaction trace) > Database queries.
Use database queries
Here are situations where you can use the Database queries page to analyze and troubleshoot a slow transaction:
- You notice on the APM Overview page that a transaction is abnormally slow.
- You select a transaction trace to get more details about that transaction.
- You select the Database queries page to examine the slow queries in the trace, and use them as the basis to troubleshoot and improve your app's performance.
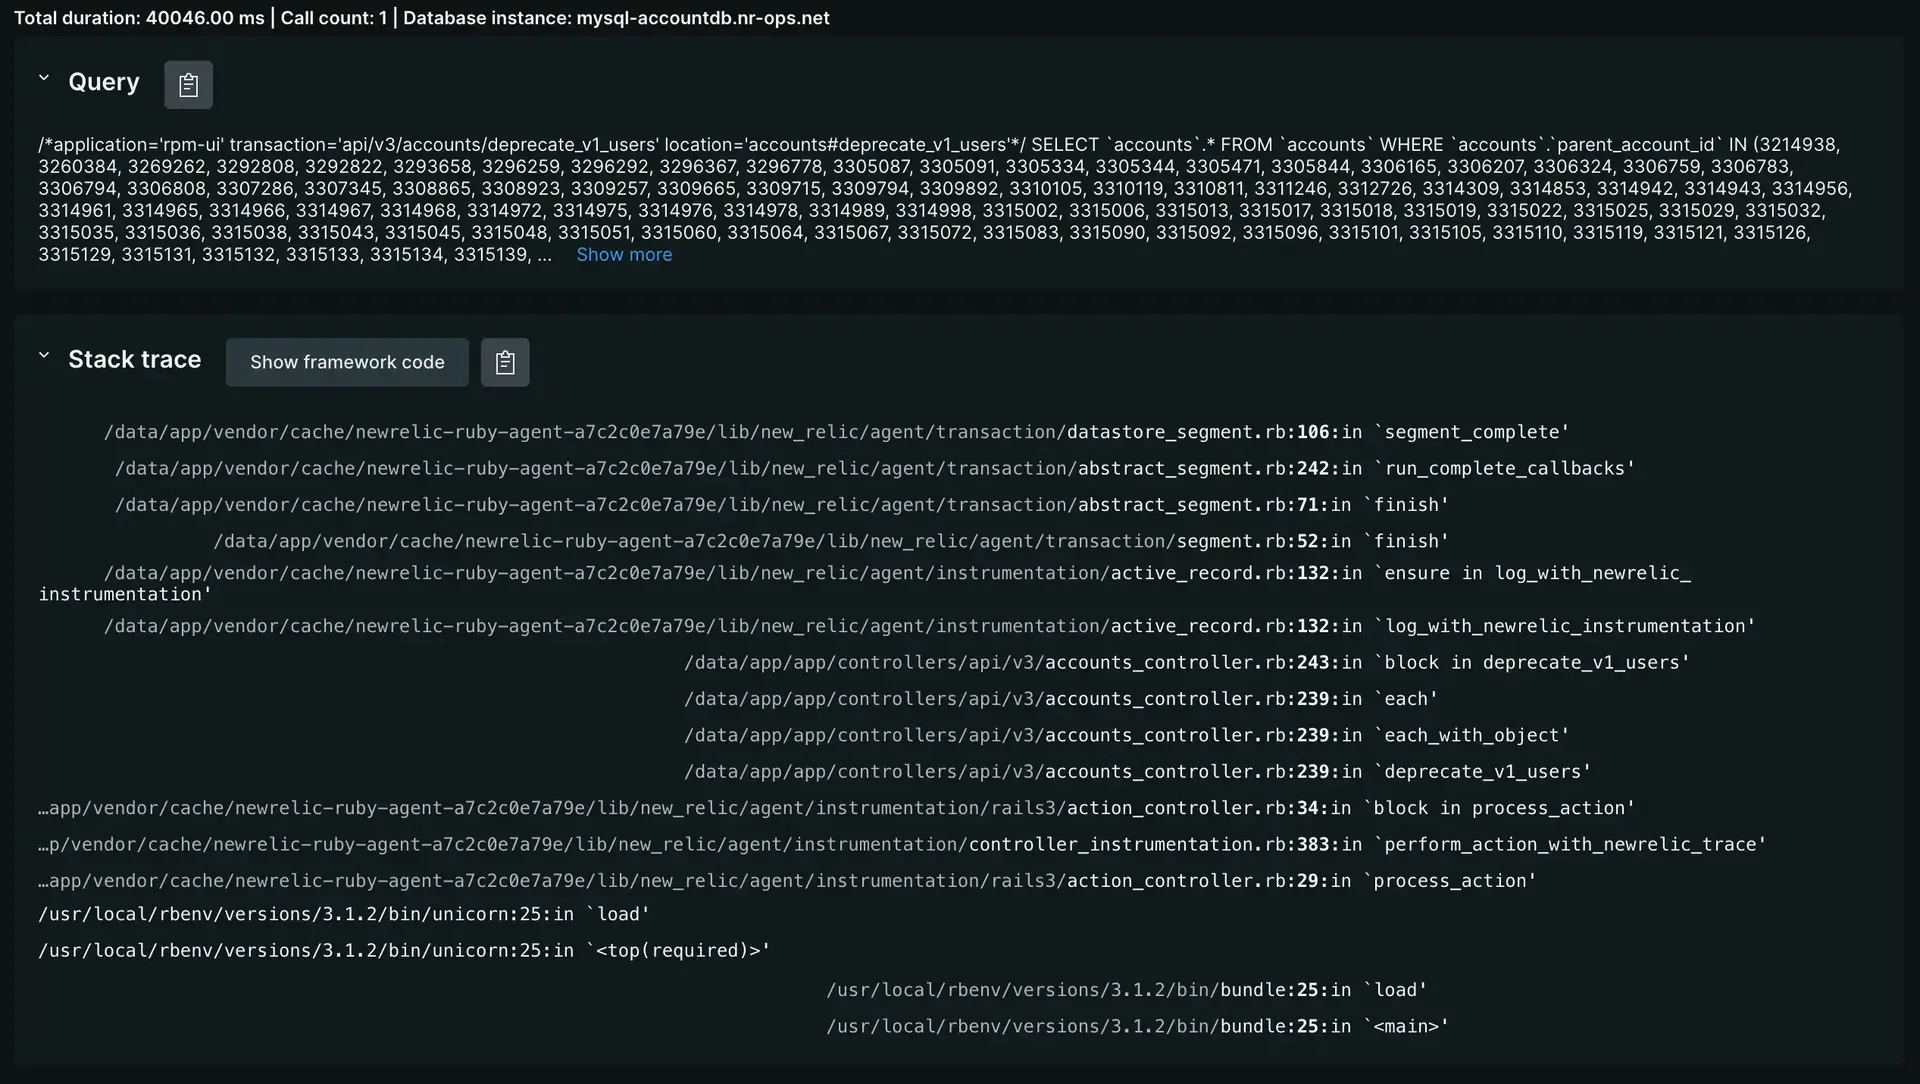
- When a stack trace associated with a database query exists, click the row in the database queries table to view the formatted stack trace.

Configure database query settings
You can change database query settings in the same way you change other transaction trace settings; for example, via configuring the New Relic agent or, for some agents, via the UI.
Common database query setting changes include:
- Collecting raw query data instead of obfuscated or turning off query collection
- Changing the stack trace threshold
- Turning on query explain plan collection
Use database queries to improve performance
Here are some tips to improve your app's database performance:
Use database queries | Comments |
|---|---|
Time | Look for queries where the |
Duplicate queries | Look for queries that repeatedly query the same kind of information; for example, multiple queries to look up individual account IDs. Try rewriting the query to |
Database overhead | Look at the structure of your queries to see if there are opportunities to combine different types of information into a single call; for example, querying for the account ID, name, etc. This is useful, for example, if your database center is in a different geographical location, because this will reduce overhead. The amount of time for your database request and response may be very fast. However, by combining requests into fewer calls, you can reduce that time even more. |
MySQL | From your app's main APM Summary page, compare the database time on the main chart to other processing time. Sudden spikes or larger amounts of database time compared to other processing times may indicate problems. |
Find other slow queries
The Trace details page is useful for examining a specific transaction's details. To see all of your application's slowest queries in one place, use the Slow queries feature.