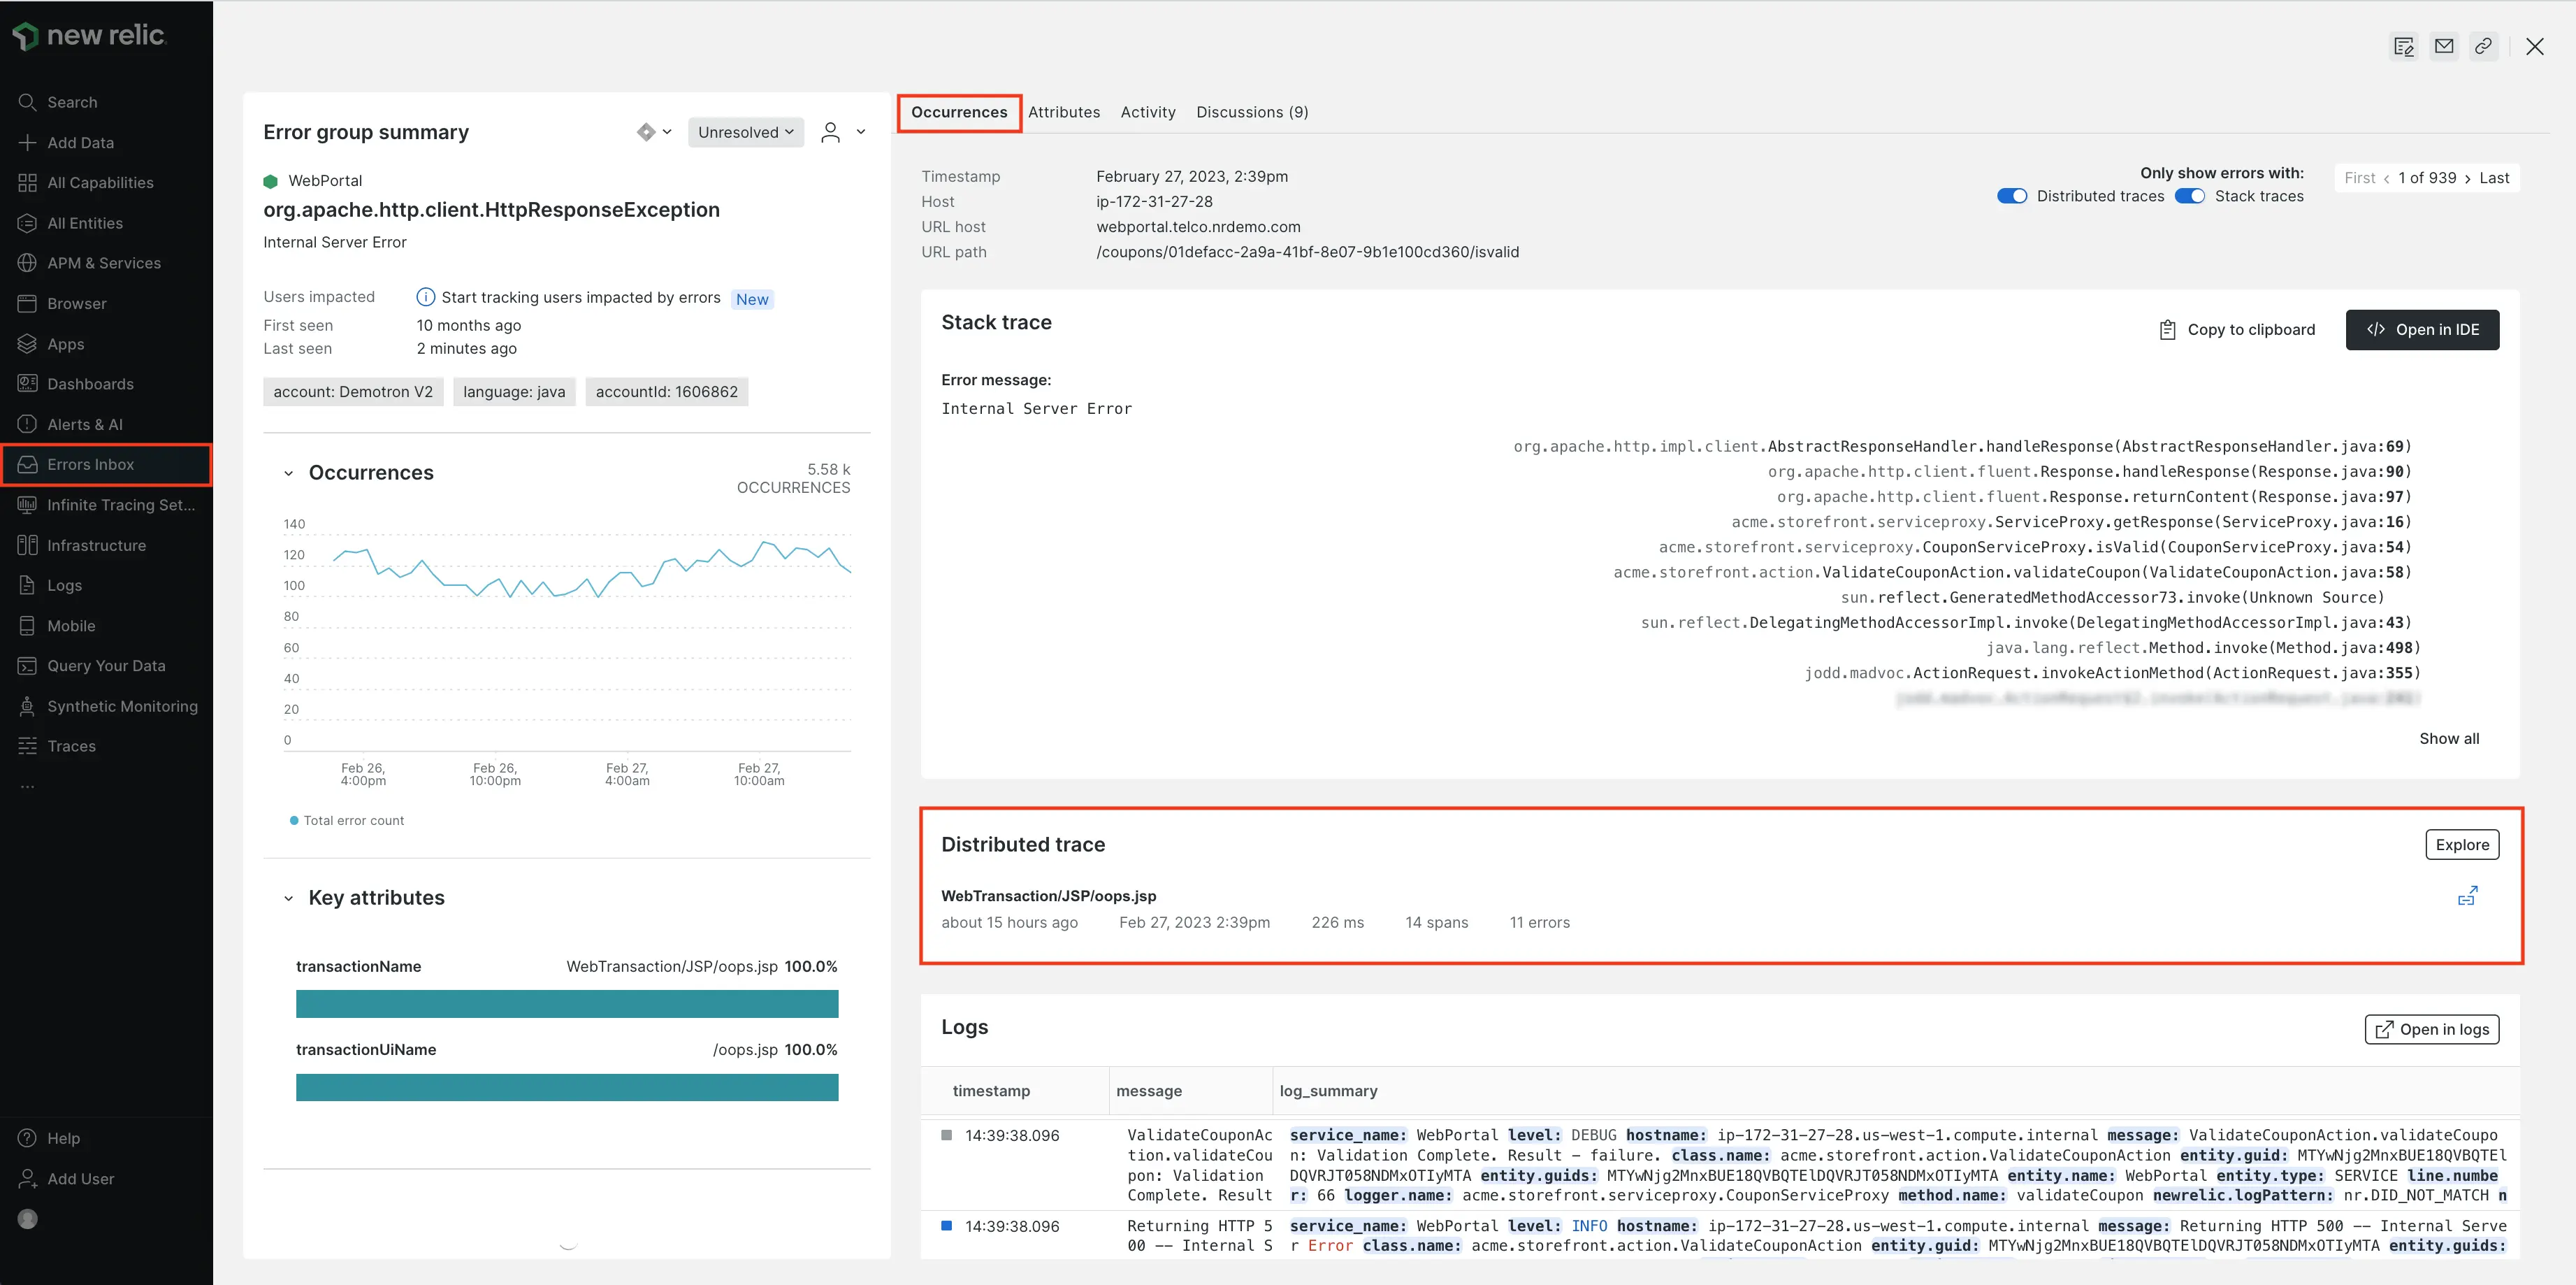
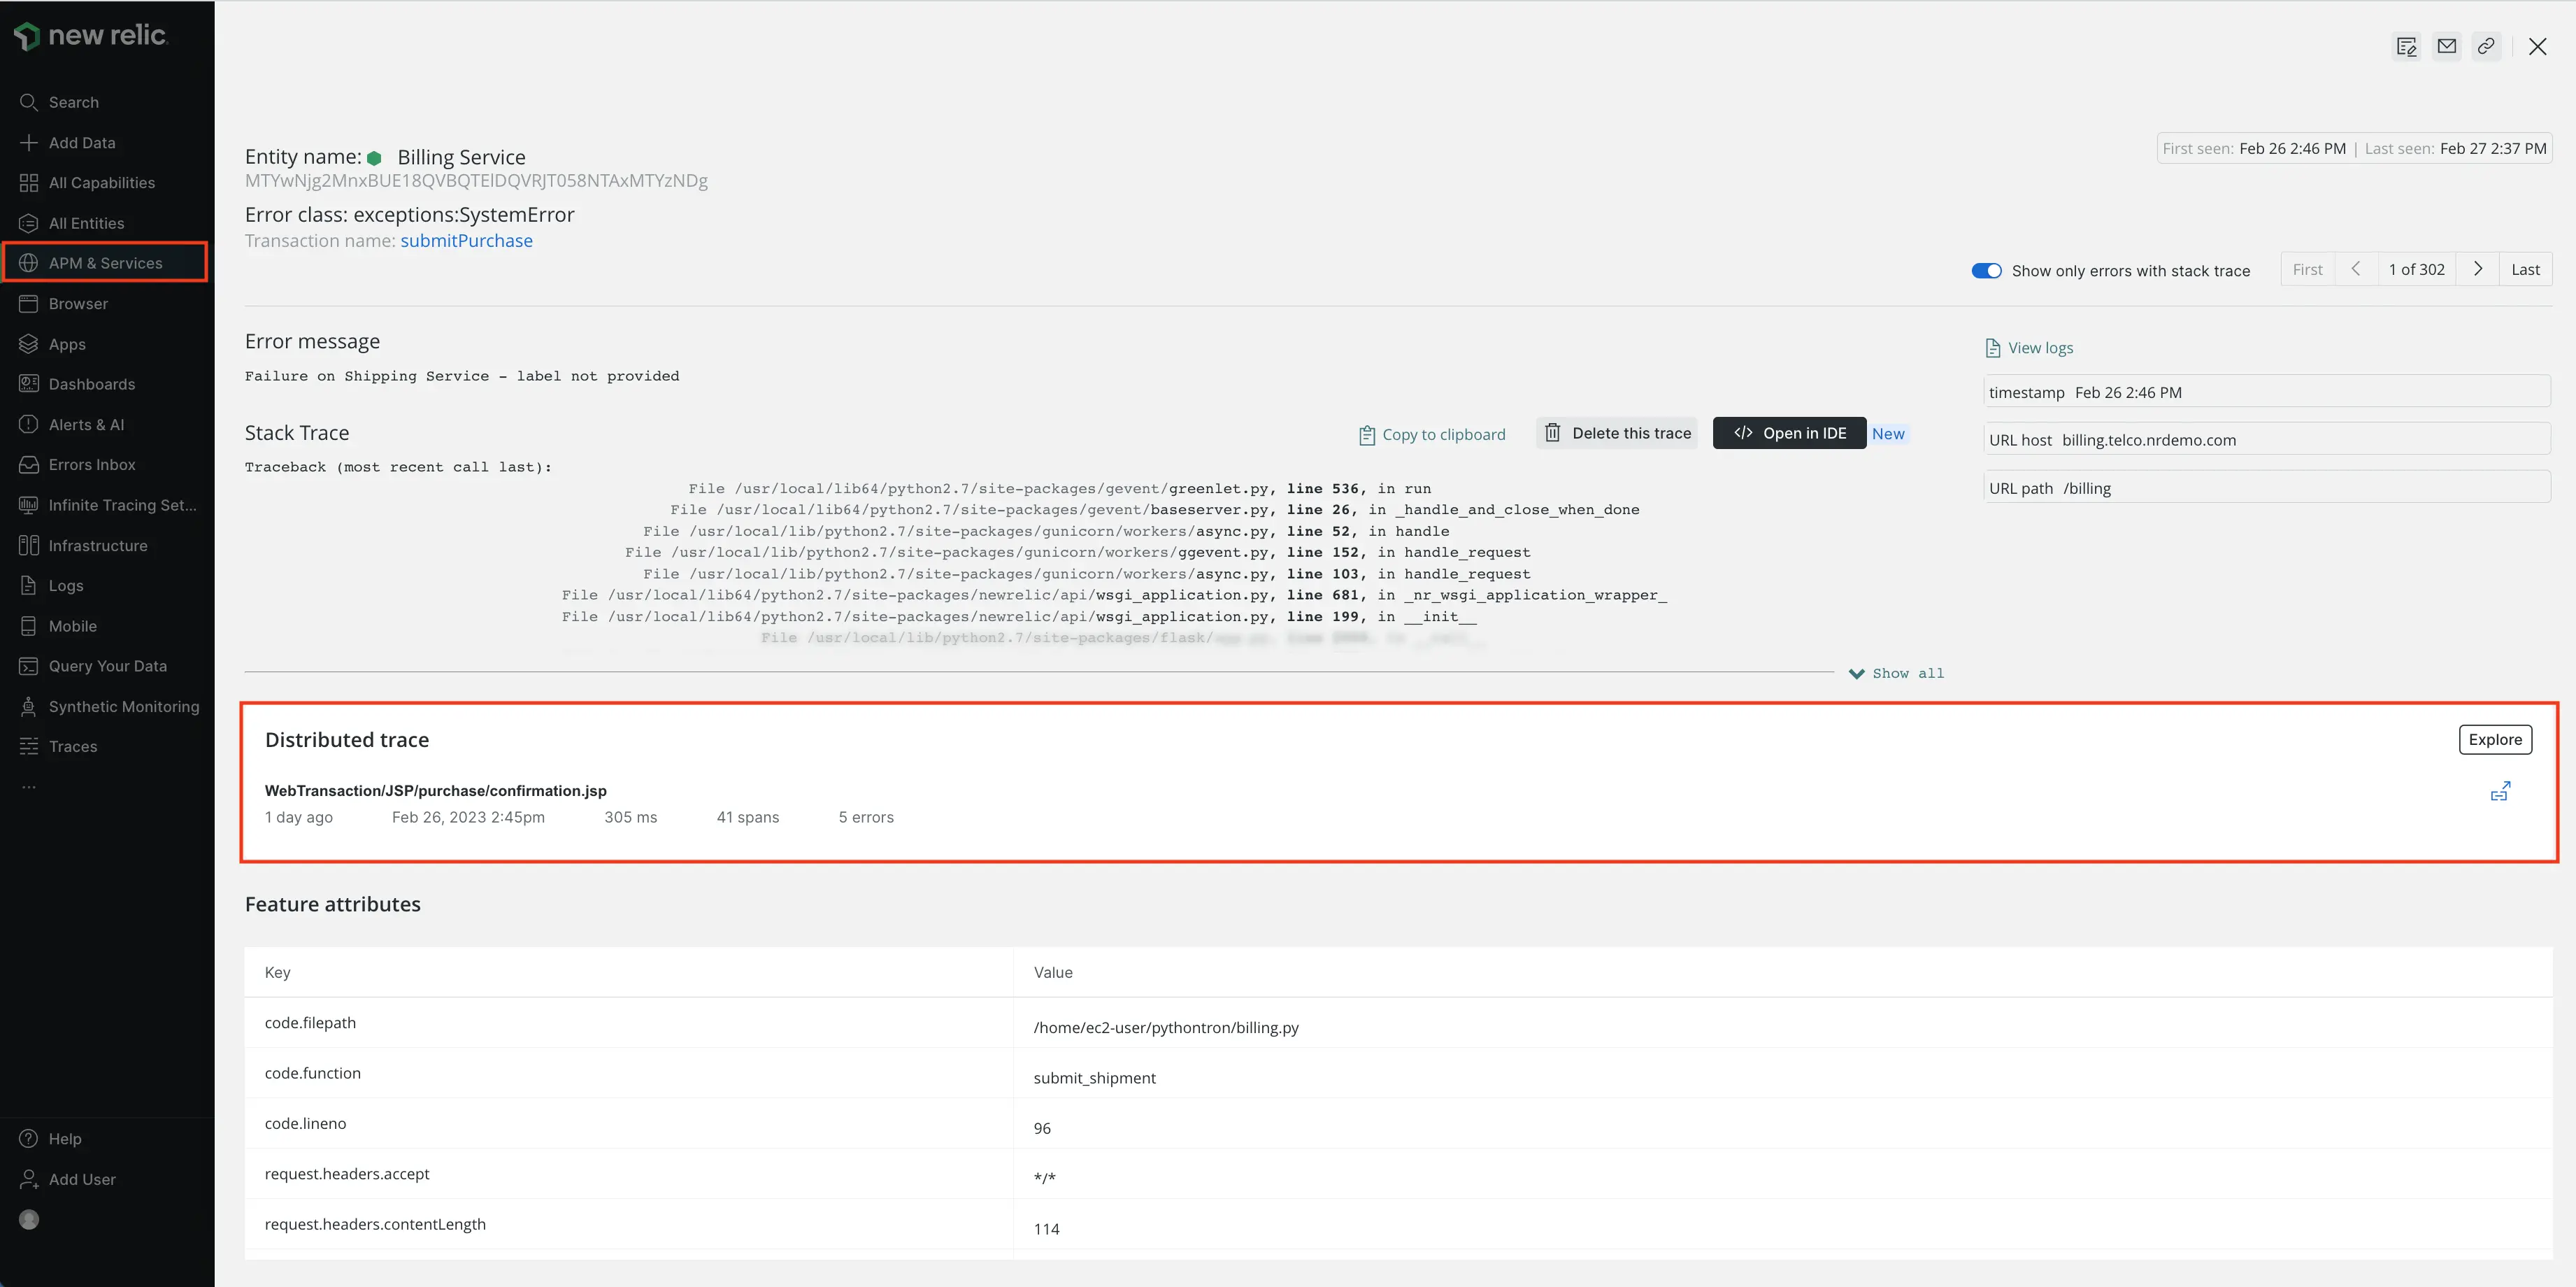
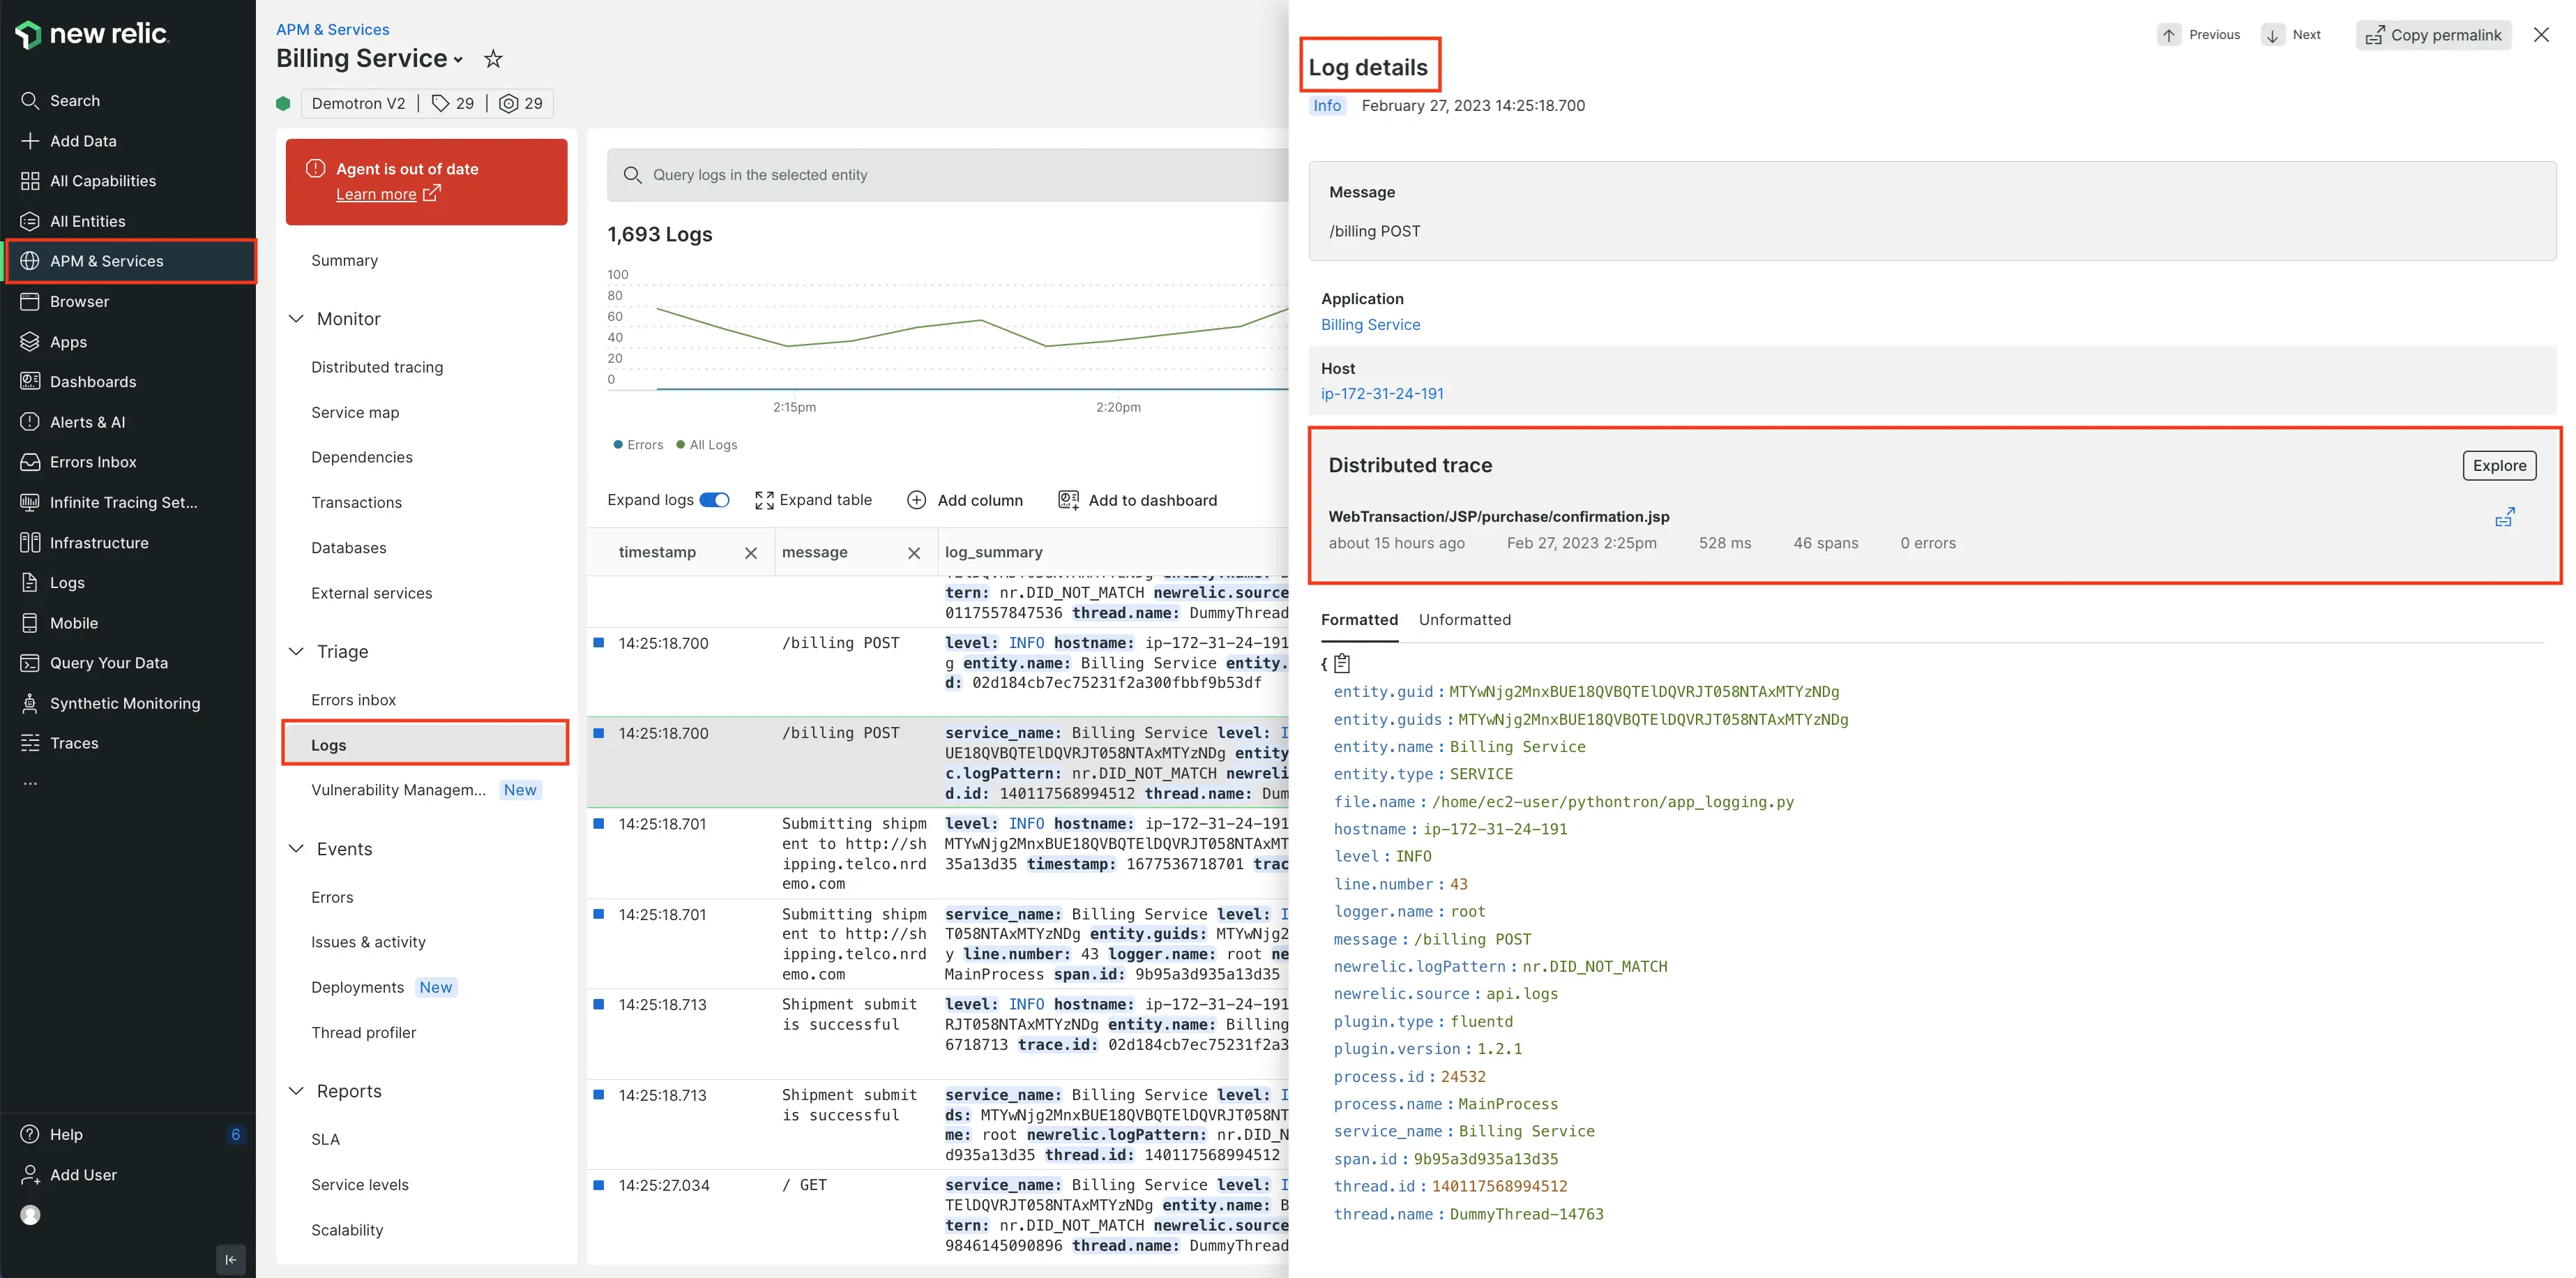
Distributed tracing already provides a powerful view of requests across your entire system. Now with traces in context, you will automatically get relevant information for related traces in errors inbox, APM errors, and logs. With this new capability, you can deep dive into a trace in one click without losing context to understand system complexity and performance with less toil.
Get started
To start using traces in context, deploy or update to the latest APM, browser, and mobile agents to each service involved in the call path you're interested in. Traces in context will be immediately available upon upgrading.
Here are some examples of how you can view traces in context:
Errors inbox

APM errors page

APM log details page

Learn more
Review the distributed tracing documentation and read our blog post.