Amazon CloudWatch Metric Streams

Amazon CloudWatch Metric Streams is an AWS service that creates a real-time stream of metrics to a destination of your choice. To stream your AWS data to New Relic, you can create a custom Firehose that forwards AWS metrics to our CloudWatch Metric Streams integration. This lets you view your AWS data in the New Relic platform.
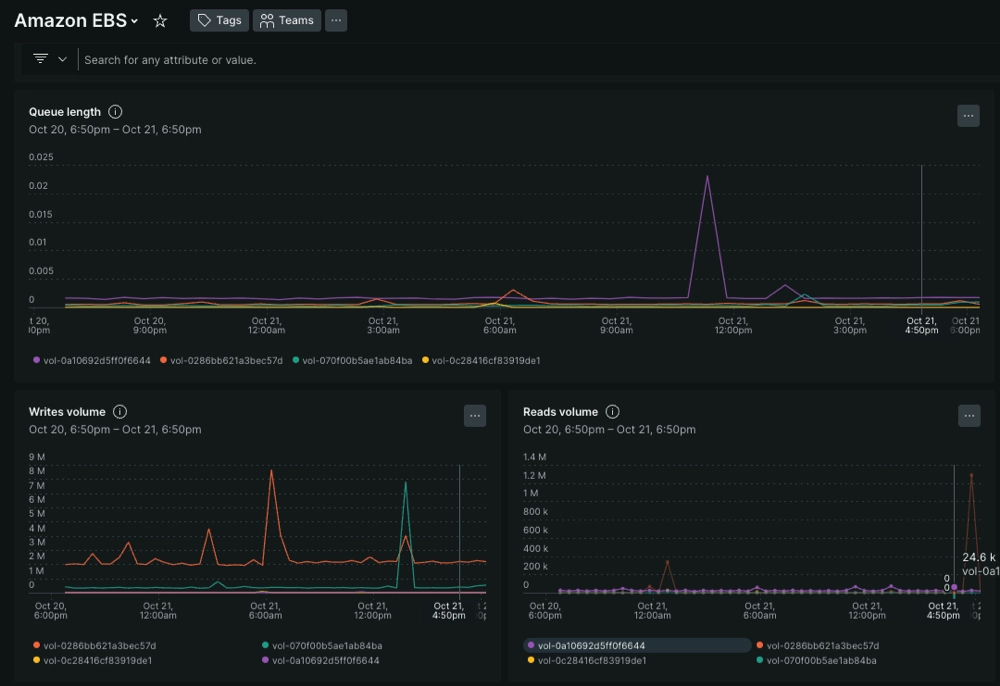
A screenshot that shows an example dashboard of AWS data in New Relic

Once you forward your AWS data to New Relic, you can view your data in a dashboard.

Choose your set-up method

Set minimum permissions

Before you integrate, you need to set certain permissions so New Relic can access your AWS data. At minimum, you need to create a ReadOnlyAccess policy and apply these minimum permissions to the AWS roles associated with New Relic:

config:BatchGetResourceConfig
config:ListDiscoveredResources
elasticache:DescribeCacheClusters
tag:GetResources

Depending on your set up, your configuration requirements may vary:

Integrate CloudWatch Metric Streams with AWS Console

This step gives you the necessary inputs to direct your metrics to New Relic. From AWS Console, you'll create a Firehose delivery stream and metric stream, then you'll go to the New Relic platform to finish set up.

  1. Create a Kinesis Data Firehose Delivery Stream and configure the following destination parameters:
    • Source: Direct PUT or other sources
    • Data transformation: Disabled
    • Record format conversion: Disabled
    • Destination: New Relic
    • Ensure the following settings are defined:
      • New Relic configuration (Destination Settings)
        • HTTP endpoint URL - US Datacenter: https://aws-api.newrelic.com/cloudwatch-metrics/v1
        • HTTP endpoint URL - EU Datacenter: https://aws-api.eu01.nr-data.net/cloudwatch-metrics/v1
        • API key: Enter your
        • Content encoding: GZIP
        • Retry duration: 60
      • S3 backup mode: Failed data only
      • S3 bucket: select a bucket or create a new one to store metrics that failed to be sent.
      • New Relic buffer conditions
        • Buffer size: 1 MB
        • Buffer interval: 60 (seconds)
      • Permissions IAM role:
        • Create or update IAM role
  2. From AWS Console, go to CloudWatch service and select the Streams option under the Metrics menu. Click Create metric stream.
  3. Determine the right configuration based on your use cases. For example, use inclusion and exclusion filters to select the services that should push metrics to New Relic.
  4. Select the Firehose you created in the first step, then define a meaningful name for the metric stream. For example, you could name it newrelic-metric-stream.
  5. Change default output format to Open Telemetry 0.7. Keep in mind that JSON isn't supported.
  6. Go to one.newrelic.com > All capabilities > Infrastructure > AWS. Click Add an AWS account, then Use metric streams. Follow the remaining steps.

Validate that your data appears in New Relic

To confirm you're receiving data from the Metric Streams, follow these steps:

  1. Go to one.newrelic.com > All capabilities > Infrastructure > AWS. Search for the AWS account you've connected to New Relic. Stream accounts.
  2. Check the account status dashboard and confirm that New Relic receives the metric data. This may include errors and number of namespaces and metrics ingested.
  3. Explore your data by writing queries for specififc sets of metrics.

It may take few minutes for New Relic to detect new resources and synthesize them as entities.

Tip

AWS CloudWatch metrics for global services, such AWS Billing, are only availble in the us-east-1 region. Make sure there's an active CloudWatch metric stream configured in that region.

What's next?

Now that you can view your AWS data, we recommend that you: