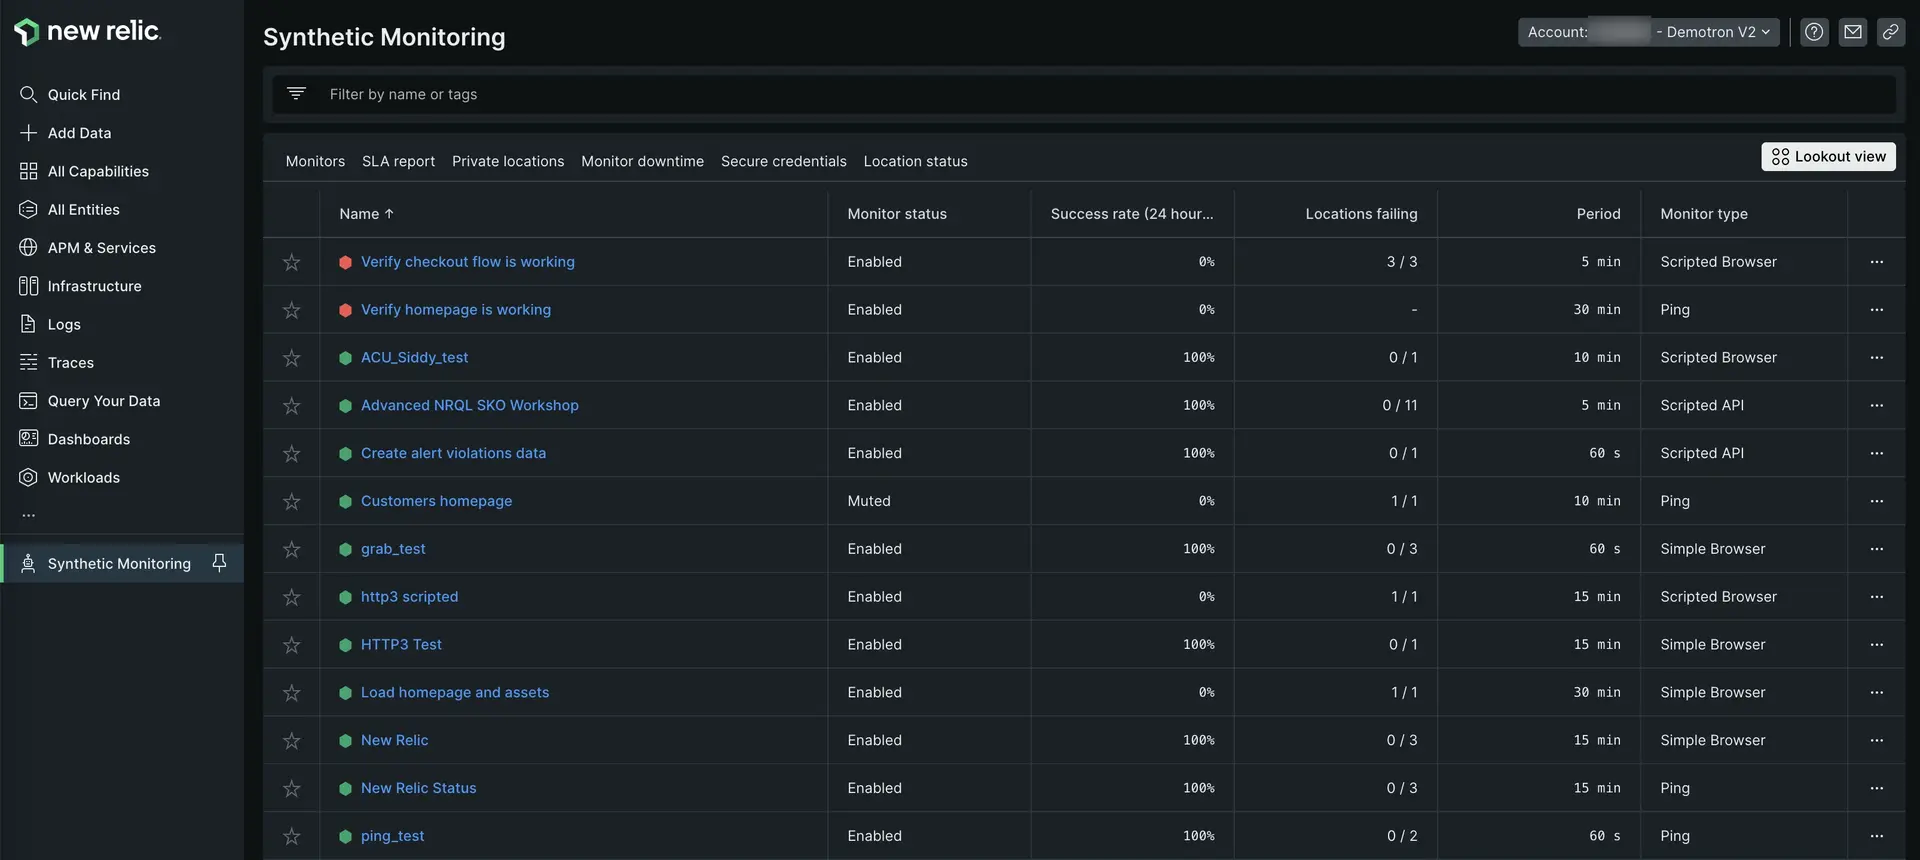
In our synthetic monitoring tool, the monitors index lists your synthetic monitors, and gives you a snapshot of each monitor's performance over the last 24 hours. Select a specific monitor to view a Summary page and get deeper insights about its performance. Or, filter the list to quickly compare the performance of similar monitors.
View the monitors index
To see a list of your synthetic monitors, go to one.newrelic.com > Synthetic monitoring.

Understand monitor metrics
Use the monitors index to access your monitors and view a snapshot of monitor performance. The index includes the following metrics:
- Alert status: Indicates the status of any alerts on the monitor:
- Green: No open alert events
- Red: Critical alert event in progress
- Grey: No alert conditions defined with alerts
- Monitor status: Indicates a status has been applied to the monitor, such as Mute or Disabled.
- Success rate: The percentage of monitor checks that end in success. A multi-step monitor that does not complete all steps is considered a failure.
- Locations failing: The number of locations that have failed during the given timeframe.
- Period: How often the monitor checks run.
- Monitor type: The selected monitor type.
Use index functions
The monitors index supports the following features:
If you want to... | Do this... |
|---|---|
Sort the monitor list | Select a column label to sort the list based on that metric. Select the label again to change the sort order from ascending to descending. |
Filter the monitor list | Type your keyword in the search box to filter by name, tags, or entitiy type. |
Add to favorites | To favorite a monitor, select the star star icon icon. Favorite monitors appear at the top of the monitor list. To remove a monitor from your favorites, select the star icon again. |