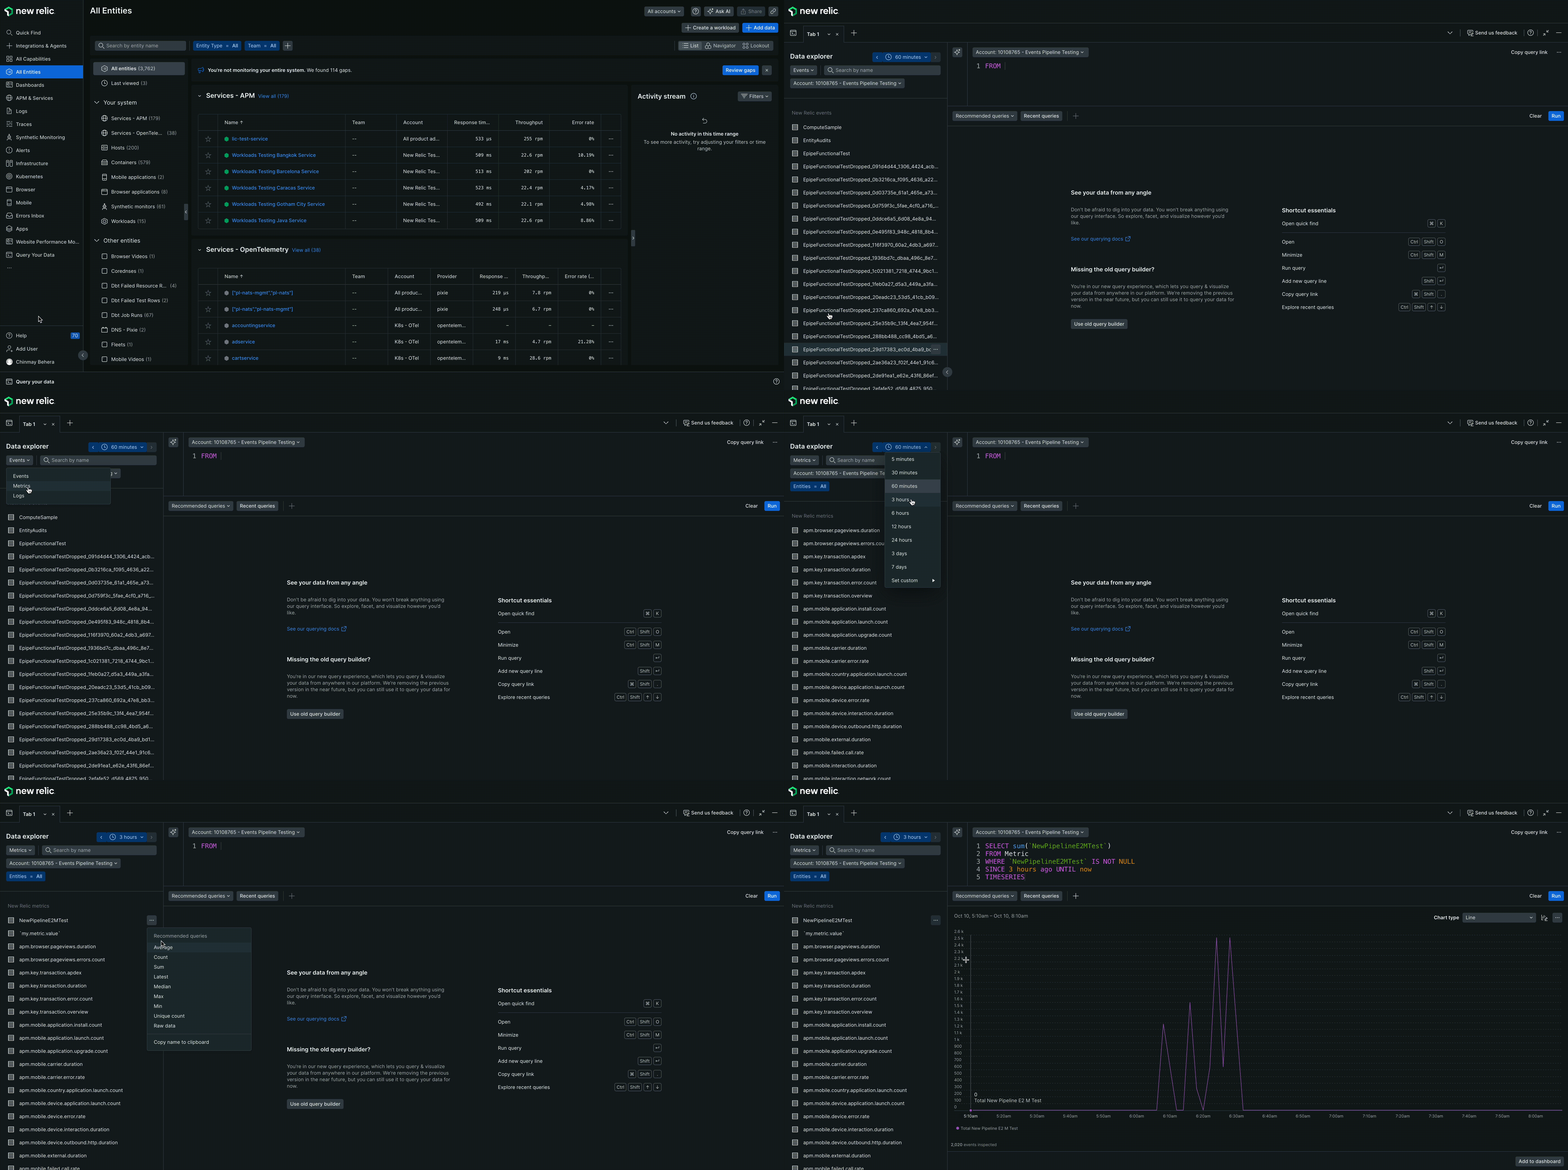
You can now explore all your data visually using the query experience data explorer without needing to know how to write NRQL-format queries.
Need to perform a more detailed search? Read how to query your data. If you haven't already, create your free New Relic account to start monitoring your data today.
Importance of data explorer
Do you research the state of your systems? Do you need to plan resources, identify and respond to alert events, or troubleshoot faulty behaviors? The data explorer makes it easy to identify, fetch and visualize the data you are looking for through visual menus, without ever using NRQL or building queries.
With the data explorer, you can access all data stored in the New Relic database (NRDB) in a quick, intuitive way. You can then select facet your queries using attributes and filter down to the needed value.
Other things the data explorer view helps you do:
- View data from different perspectives: from raw data to various visualizations that give insights on evolution, distribution, and more.
- Drill down into data using filters.
- View a prediction based on the trend of your data (available with the public preview of NRQL Predictions).
- Add your searches to a dashboard.
- Understand how NRQL works: the Data Explorer automatically generates the NRQL queries based on your selections.
Types of data you can explore
Following are the types of data you can explore using the Data Explorer view:
- Dimensional metrics (the Metric data type).
- Events (the Event data type).
- Logs (the Log data type).
- Timeslices ( agents, mobile agents, and the agent report this data type. To explore this type of data, you must choose an entity monitored by one of those agents, and then you'll see those options.).
- Lookups (the Lookup data type).
Explore your data
To access the Data Explorer, navigate to the bottom Query your data bar and click the Data Explorer icon.
Use the data explorer
- Define the Scope: Select the data type (metric, event, or log), the account, and the entities.
- Select the Time Range: Use the time picker to define the time range for your query.
- Build Your Search: Use the blocks on the left to browse the available data and construct your search. Blocks are searchable, and you can use the actions in the action menu to create and update your query.
- Refine your query: Modify your query by adding filters, facets, and aggregations.
- Customize the chart visualization: Upgrade your chart visualization from the customization options available.
- Add prediction to a line or area chart (available with the public preview of NRQL Predictions): Use Predict trend from the Options menu to get a predicted trend.
- Add to dashboard: Add your chart to a dashboard for future reference.

Components of the data explorer
- Select Your Data Type: Choose between metrics, events, logs, and accounts. If you select metrics, you can filter by entity.
- Data Browsing Area: Located on the left, this area allows you to navigate the data by clicking on the different values displayed on the screen or see the possible actions by clicking on the 3 dots action menu.
- Workspace: This area displays the results of your selections.