Our workloads feature gives you the ability to group and monitor entities in whatever way you want. This gives you the power to organize your telemetry data in ways that make the most sense for your business.
Want to try New Relic workloads? Create a New Relic account for free, forever!
What is a workload?
New Relic monitors a wide range of entities and data, from client-side applications and backend APIs, to the underlying infrastructure. To make sense of this large data set, we give you the ability to create and monitor workloads.
Our workloads feature lets you group and monitor entities in whatever way makes sense to you. For example, you could create a workload for a specific business unit or team. Our workloads UI provides an aggregated view of the health and activity of the entities in that workload. Thus, you can better understand how your business logic is working, from frontend to backend services, across your entire stack.
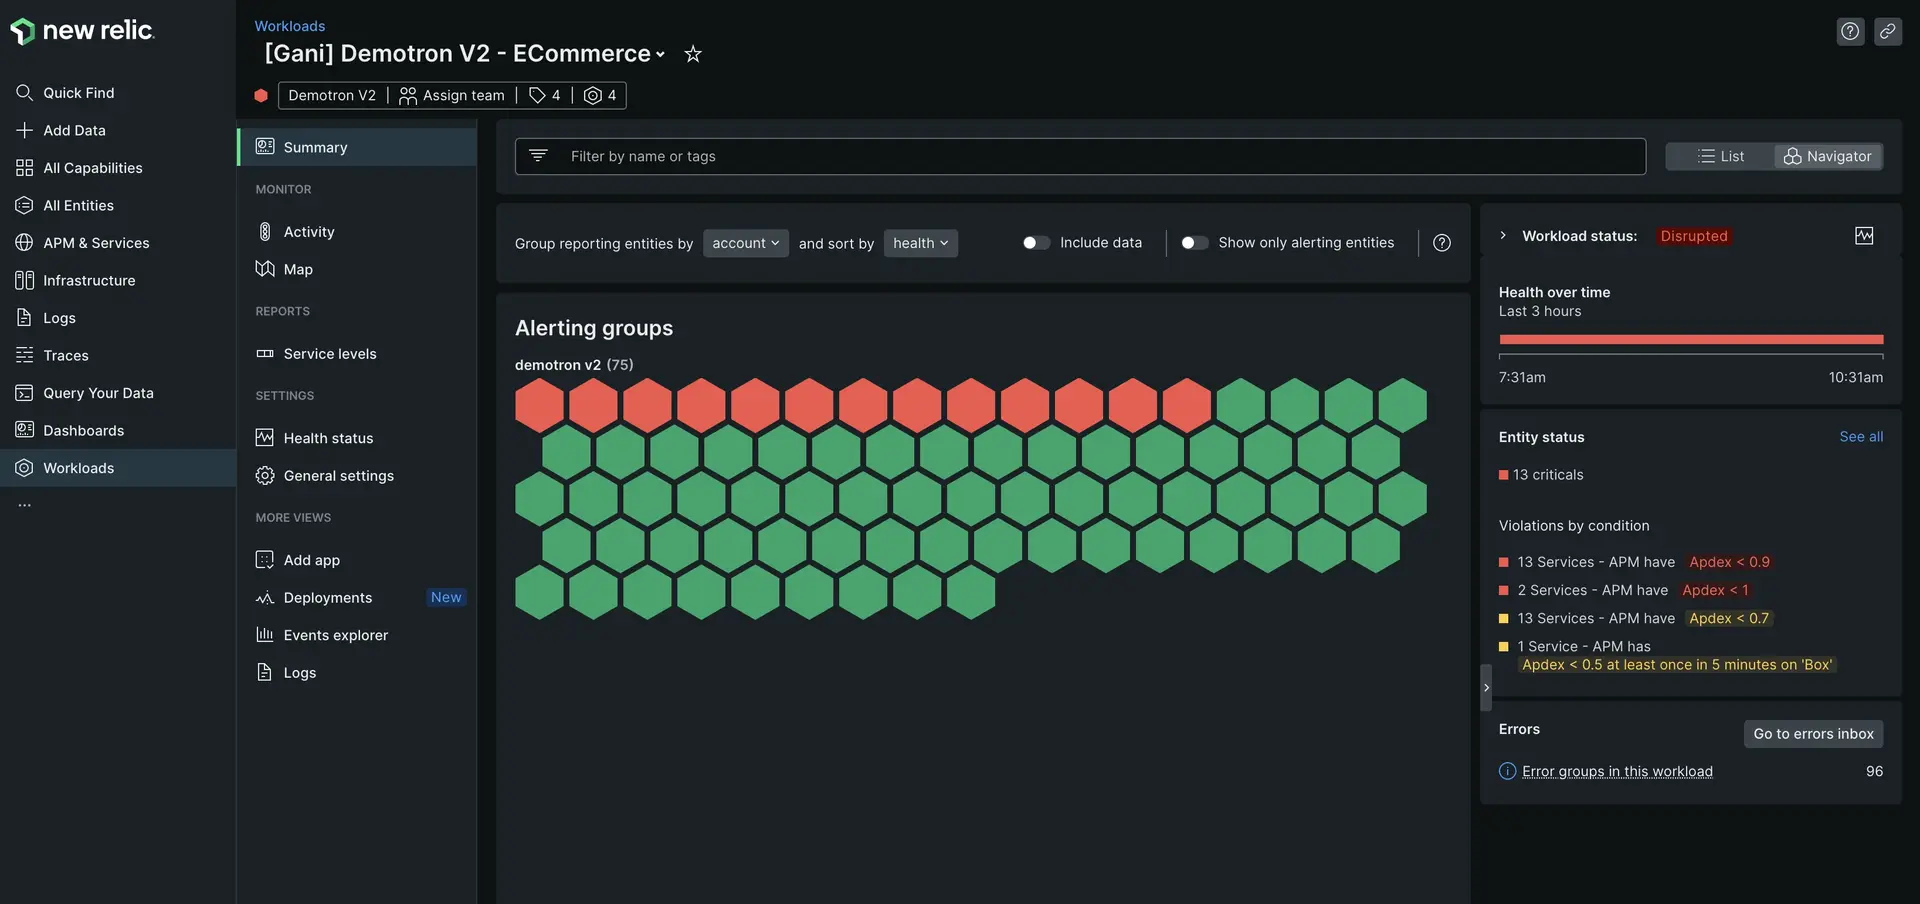
Here's an example of a workload in our workloads UI:

one.newrelic.com > All capabilities > Workloads > (selected workload): The workloads UI provides a curated view of how the entities in your workload are performing. The charts you see will depend on the types of entities you've included to the workload.
A workload can include:
- Any New Relic-monitored entity, including applications, browser apps, mobile apps, databases, and hosts.
- Dashboards.
- Other workloads: this is useful for complex teams who need to divide and overlap workloads.
Here are some examples of things an organization might have in a workload:
- A serverless application that includes an API gateway, a few serverless functions, and a managed database and storage.
- A browser application and the backend APIs that support it.
- A collection of Java microservices and the infrastructure they run on.