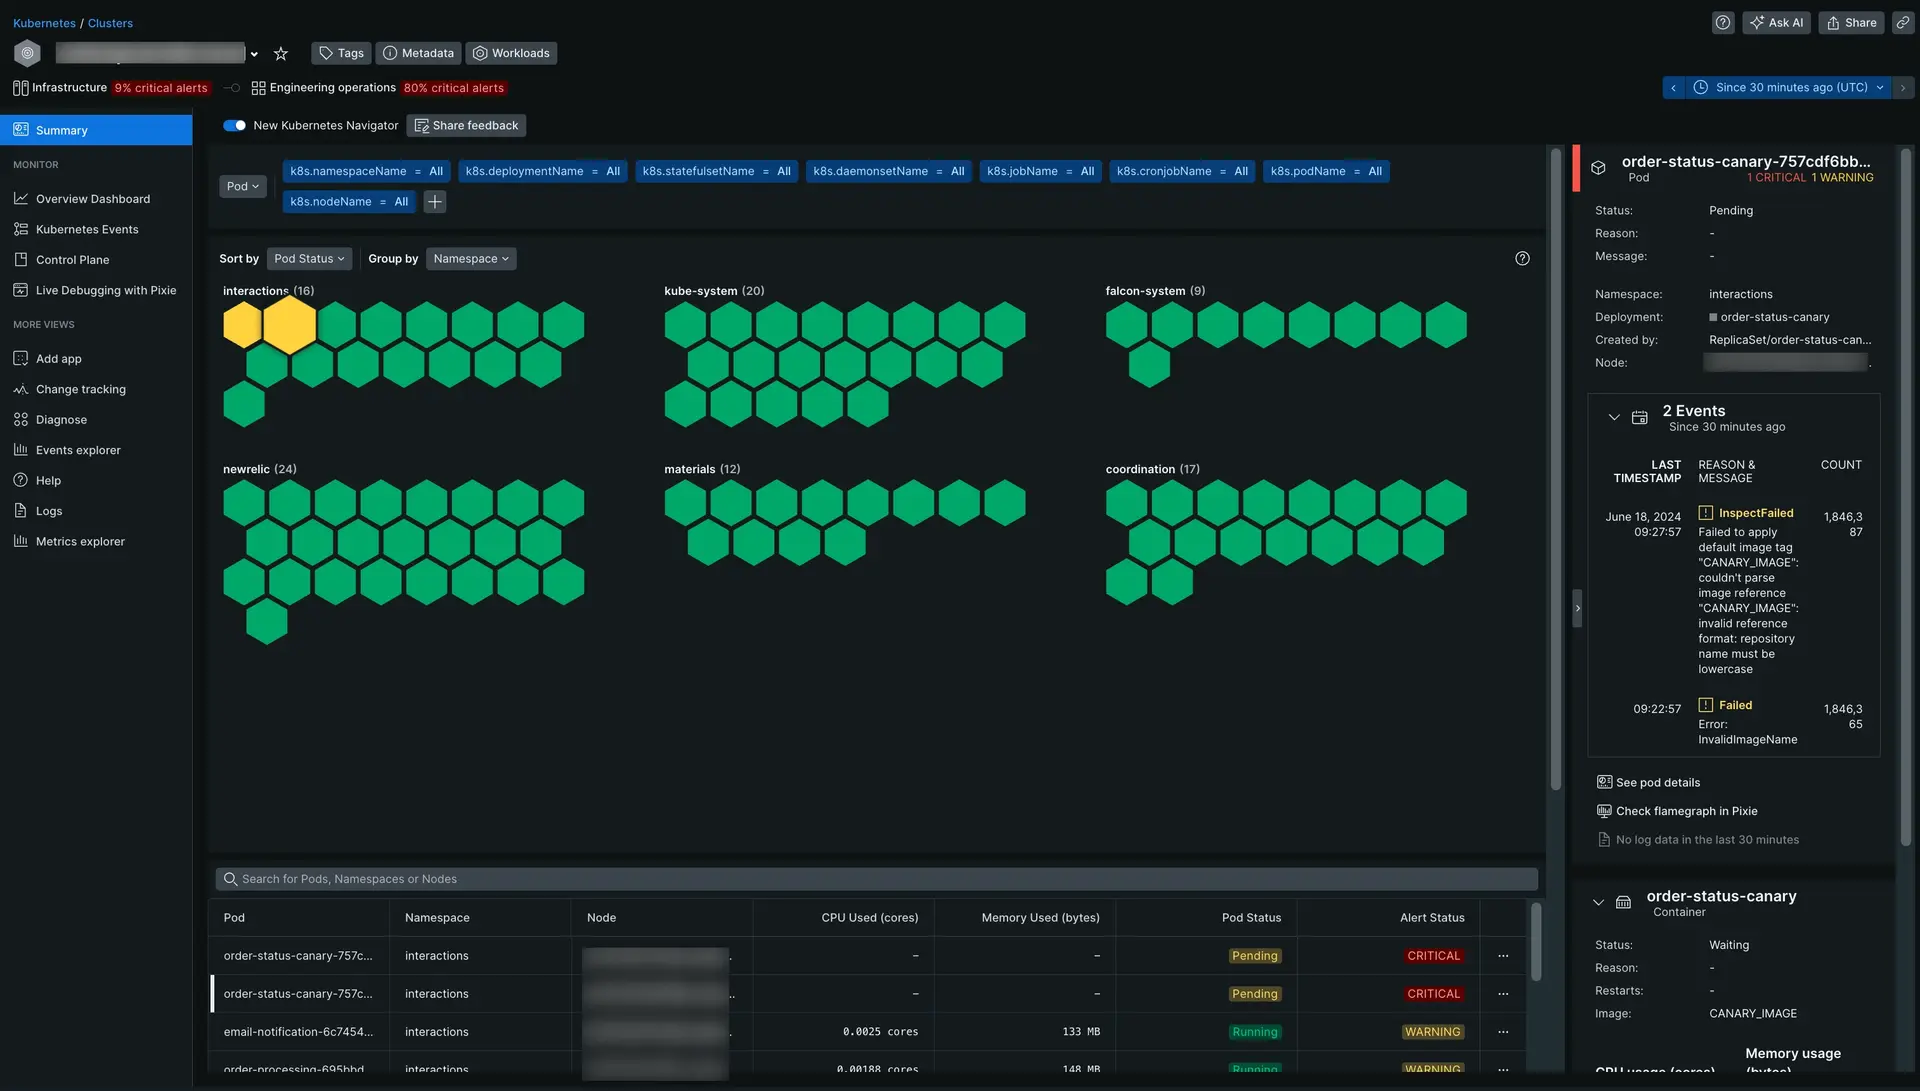
Kubernetes is an open-source tool for automating deployments, scaling, and managing containerized applications. The New Relic Kubernetes monitoring integration gives you a quick and easy way to see what's going on with your Kubernetes clusters and workloads, whether they're hosted on-premises or in the cloud.
Once you've got the Kubernetes integration up and running, you can start monitoring all the services running on Kubernetes in one place with our Kubernetes out-of-the-box experiences. It shows you everything from the top of the control plane down to the applications running on a single pod, so you can get to the heart of how your cluster works.

Go to one.newrelic.com > All capabilities > Kubernetes and choose your cluster. The cluster explorer is our handy, all-in-one solution for all your Kubernetes needs when you're running at large scale.
Monitoring Kubernetes with New Relic
Managing Kubernetes can be tough. There's a lot going on all the time, with containers being created and deleted in minutes, apps crashing, and resources being used in unexpected ways. Our integration helps you figure out how to use Kubernetes in different ways, whether you're using it on-premises, in the cloud, or in a hybrid setup.
Take a look at what you can do with New Relic:
Monitor the Kubernetes control plane to manage and collect metrics from your clusters.
Collect, process, explore, query, and alert on your log data by forwarding your Kubernetes logs to New Relic, giving you more ways to manage your log data.
Build your own charts and query all your Kubernetes data that our integration collects by instrumenting the container orchestration layer. This gives you more insight into nodes, namespaces, deployments, replica sets, pods, and containers.
Link your APM data to Kubernetes to measure how well your web and mobile apps are performing. You can track things like request rate, throughput, error rate, and availability.
Monitor services running on Kubernetes, like Apache, NGINX, Cassandra, and many more. Check out our tutorial for monitoring Redis on Kubernetes.
Scrape Prometheus metrics from any workload in the cluster thanks to the service discovery provided by the Prometheus Agent.
The integration includes a set of predefined alert conditions, but you can create and modify your Kubernetes alerts based on your Kubernetes data, or add a set of recommended alert policies.
Check out all your Kubernetes events. The Kubernetes events integration watches for events happening in your Kubernetes clusters and sends those events to New Relic. You can then visualize the event data in the cluster explorer. It's installed by default after installing the New Relic Kubernetes integration.
Report data to Kubernetes that triggers pod autoscaling so you always have resources available when demand spikes, like during a peak demand event.

one.newrelic.com > All capabilities > Kubernetes cluster explorer > Events: Browse and filter all your Kubernetes events, and dig into application logs and infrastructure data.
These features are in addition to the data New Relic already reports for containerized processes running on instrumented hosts.
Check the source code
This integration is open source software. That means you can browse its source code and send in your own improvements, or you can create your own fork and build it. For more information, check out the README file.
Tip
Are you using Datadog to monitor Kubernetes but want to try out New Relic's monitoring capabilities for free? See our guide on how to migrate from Datadog to learn more.