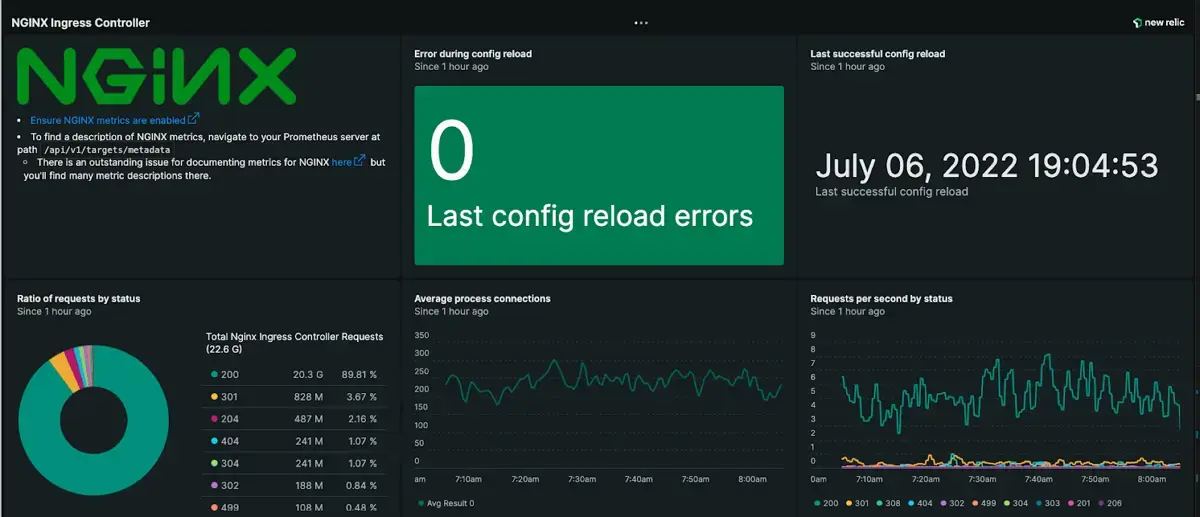
NGINX Ingress Controller is a specialized load balancer for Kubernetes (and other containerized) environments. An Ingress controller abstracts away the complexity of Kubernetes application traffic routing and provides a bridge between Kubernetes services and external ones.
The NGINX Ingress Controller exposes metrics that can be scraped by a Prometheus server or agent. These metrics inform you of ongoing process connections and the current ingress load that your system is handling. These metrics also inform you on ingress config reloads and empower alert conditions on config reload errors or unexpected config changes.
Use New Relic to increase visibility into your NGINX Ingress Controller performance and alert on potential configuration errors. With New Relic you can monitor:
- Config reload monitoring (errors and last successful reload)
- Throughput faceted by ingress classes
- Request and response insights on payload size and response time
- CPU and memory statistics

Enable the integration
Follow these steps to enable the integration.
Follow the NGINX Ingress Controller documentation for Prometheus to discover the metrics endpoints.
Set up Prometheus monitoring. Prometheus metrics needs to be integrated with New Relic, you can use the Prometheus Agent or the Remote Write integration, see how to send Prometheus metrics.
Important
The Prometheus Agent only scrapes metrics by default from a set of integrations.
In this case, you must identify your pod or endpoint with one of the these labels
app.kubernetes.io/name,app.newrelic.io/name,k8s-appcontaining the stringnginx.Use the following query to confirm metrics are being ingested as expected:
FROM Metric SELECT count(*) WHERE metricName LIKE 'nginx_%' FACET metricName LIMIT MAXInstall the NGINX Ingress Controller quickstart to access built-in and alerts.
Once you imported, you can edit or clone the assets to adapt them to your specific requirements.
Important
Some charts of the dashboard include queries with conditions that require the identification of your pod or endpoint with one of the these labels
app.kubernetes.io/name,app.newrelic.io/name,k8s-appcontaining the stringnginx.
Find and use the data
Metrics
Prometheus metrics are stored as dimensional metrics. You can query using NRQL or use the Data Explorer to browse the available metrics, facet, and filter by the associated dimensions.
The different sets of metrics exposed by this integration are defined in the NGINX Ingress Controller documentation.
Use the following NRQL queries to understand the metrics being ingested in New Relic:
List unique metric names:
FROM Metric SELECT uniques(metricName) WHERE metricName LIKE 'nginx_%' LIMIT MAXCount number of metric updates:
FROM Metric SELECT datapointcount() WHERE metricName LIKE 'nginx_%' LIMIT MAXEstimate data ingestion (daily ingest, in bytes):
FROM Metric SELECT bytecountestimate() WHERE metricName LIKE 'nginx_%' SINCE 1 day ago
Troubleshooting
Follow the troubleshooting tips from NGINX Ingress Controller documentation to make sure that metrics are configured as expected on your cluster.
You can also check the specific troubleshooting guidelines for Prometheus integrations.