Etcd is a strongly consistent, distributed key-value store that provides a reliable way to store data that needs to be accessed by a distributed system or cluster of machines. It gracefully handles leader elections during network partitions and can tolerate machine failure, even in the leader node.
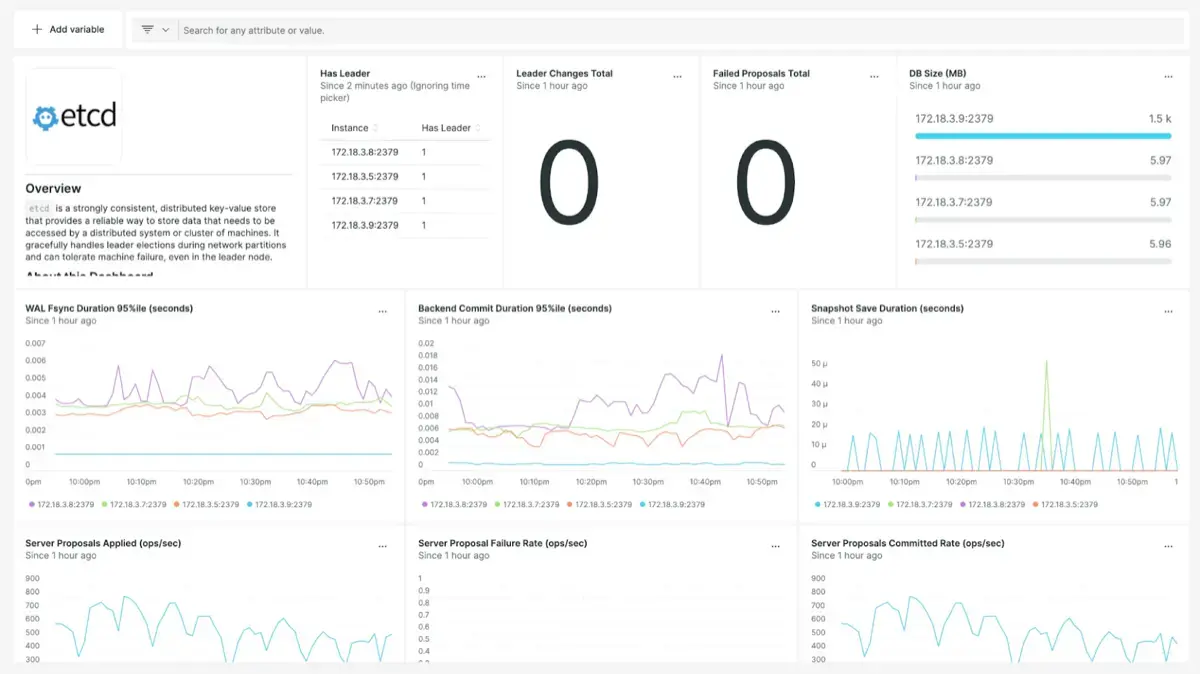
Use New Relic to display a curated dashboard based on Prometheus metrics which helps you understand the health of your Etcd cluster. With New Relic you can monitor:
- Leader changes
- Server proposals failures and committed
- gRPC stats
- Disk write latency

Enable the integration
Follow these steps to enable the integration.
Follow the Etcd documentation for Prometheus to discover the metrics endpoints.
Set up Prometheus monitoring. Prometheus metrics needs to be integrated with New Relic, you can use the Prometheus Agent or the Remote Write integration, see how to send Prometheus metrics.
Important
The Prometheus Agent only scrapes metrics by default from a set of integrations.
In this case, you must identify your pod or endpoint with one of the these labels
app.kubernetes.io/name,app.newrelic.io/name,k8s-appcontaining the stringetcd.Use the following query to confirm metrics are being ingested as expected:
FROM Metric SELECT count(*) WHERE metricName LIKE 'etcd_%' FACET metricName LIMIT MAXInstall the Etcd quickstart to access built-in and alerts.
Once you imported, you can edit or clone the assets to adapt them to your specific requirements.
Important
Some charts of the dashboard include queries with conditions that require the identification of your pod or endpoint with one of the these labels
app.kubernetes.io/name,app.newrelic.io/name,k8s-appcontaining the stringetcd.
Find and use the data
Metrics
Prometheus metrics are stored as dimensional metrics. You can query using NRQL or use the Data Explorer to browse the available metrics, facet, and filter by the associated dimensions.
The different sets of metrics exposed by this integration are defined in the Etcd documentation.
Use the following NRQL queries to understand the metrics being ingested in New Relic:
List unique metric names:
FROM Metric SELECT uniques(metricName) WHERE metricName LIKE 'etcd_%' LIMIT MAXCount number of metric updates:
FROM Metric SELECT datapointcount() WHERE metricName LIKE 'etcd_%' LIMIT MAXEstimate data ingestion (daily ingest, in bytes):
FROM Metric SELECT bytecountestimate() WHERE metricName LIKE 'etcd_%'SINCE 1 day ago
Troubleshooting
Follow the troubleshooting tips from Etcd documentation to make sure that metrics are configured as expected on your cluster.
You can also check the specific troubleshooting guidelines for Prometheus integrations.