The New Relic UI gives you a complete view of your AWS system, making monitoring much easier. You can view metrics and monitor multiple AWS accounts that send metrics to a single account linked to New Relic. For this feature to work, you must send metrics from different AWS accounts that you want to monitor to a single AWS account. You can then monitor those different AWS accounts with the metrics enriched with the appropriate tags and metadata. You can easily track performance metrics while reducing overall infrastructure costs, which means you'll save time and money.
Having a single view of all your AWS accounts helps you:
Reduce the number of friction points by setting up a single observe account for AWS.
Reduce overall infrastructure costs by reducing the number of streams sending metrics to observability solutions.
Get tagged and metadata-enriched metrics from your AWS accounts.
Before you start
Check the following:
You've configured Amazon CloudWatch to send metrics to a single AWS account that must be connected to New Relic.
You're using AWS Resource Groups Tagging API Reference to collect tags.
You're using AWS config to collect metadata.
All IAM roles have access to fetch tags from individual accounts.
You use the IAM role used in the AWS observe account on all AWS accounts to monitor.
You have CloudWatch cross-account observability properly set up. See Set up AWS cross-account access.
Get started
Follow these steps to set up cross-account observability and start viewing your multi-account AWS data in New Relic.
Set up AWS cross-account access
You need access to the AWS Management Console for both your monitoring and source accounts. Here's what each account type means:
- Source AWS account(s): Individual AWS accounts that generate observability data for their resources. Source accounts share their observability data with the monitoring account.
- Monitoring AWS account: A central AWS account that can view and interact with observability data generated from source accounts. It collects telemetry from these accounts and pushes it to New Relic.
For complete setup instructions, see AWS documentation on CloudWatch cross-account observability.
While configuring cross-account access, follow these best practices:
- Use a dedicated monitoring account: AWS recommends creating a dedicated new AWS account as your monitoring account.
- Select metrics for sharing: When linking source accounts, make sure you select Metrics as the telemetry type to share. You can optionally filter which metric namespaces to include.
- One sink per region: Each account can have one sink per region. If you need to monitor multiple regions, set up a sink for each region.
- Enable cross-account metrics in your stream: After linking your accounts, verify that your CloudWatch metric stream has Include source account metrics enabled. You can find this setting in your metric stream configuration.
- Link multiple source accounts: You can link source accounts individually or use AWS CloudFormation StackSets to link accounts across your AWS Organization.
Connect your AWS observe account to New Relic
To start receiving Amazon data with New Relic AWS integrations, connect your AWS monitoring account to New Relic. This is the account that receives metrics from all your other AWS accounts.
You can integrate using one of these methods:
Explore your AWS data
To explore your AWS data:
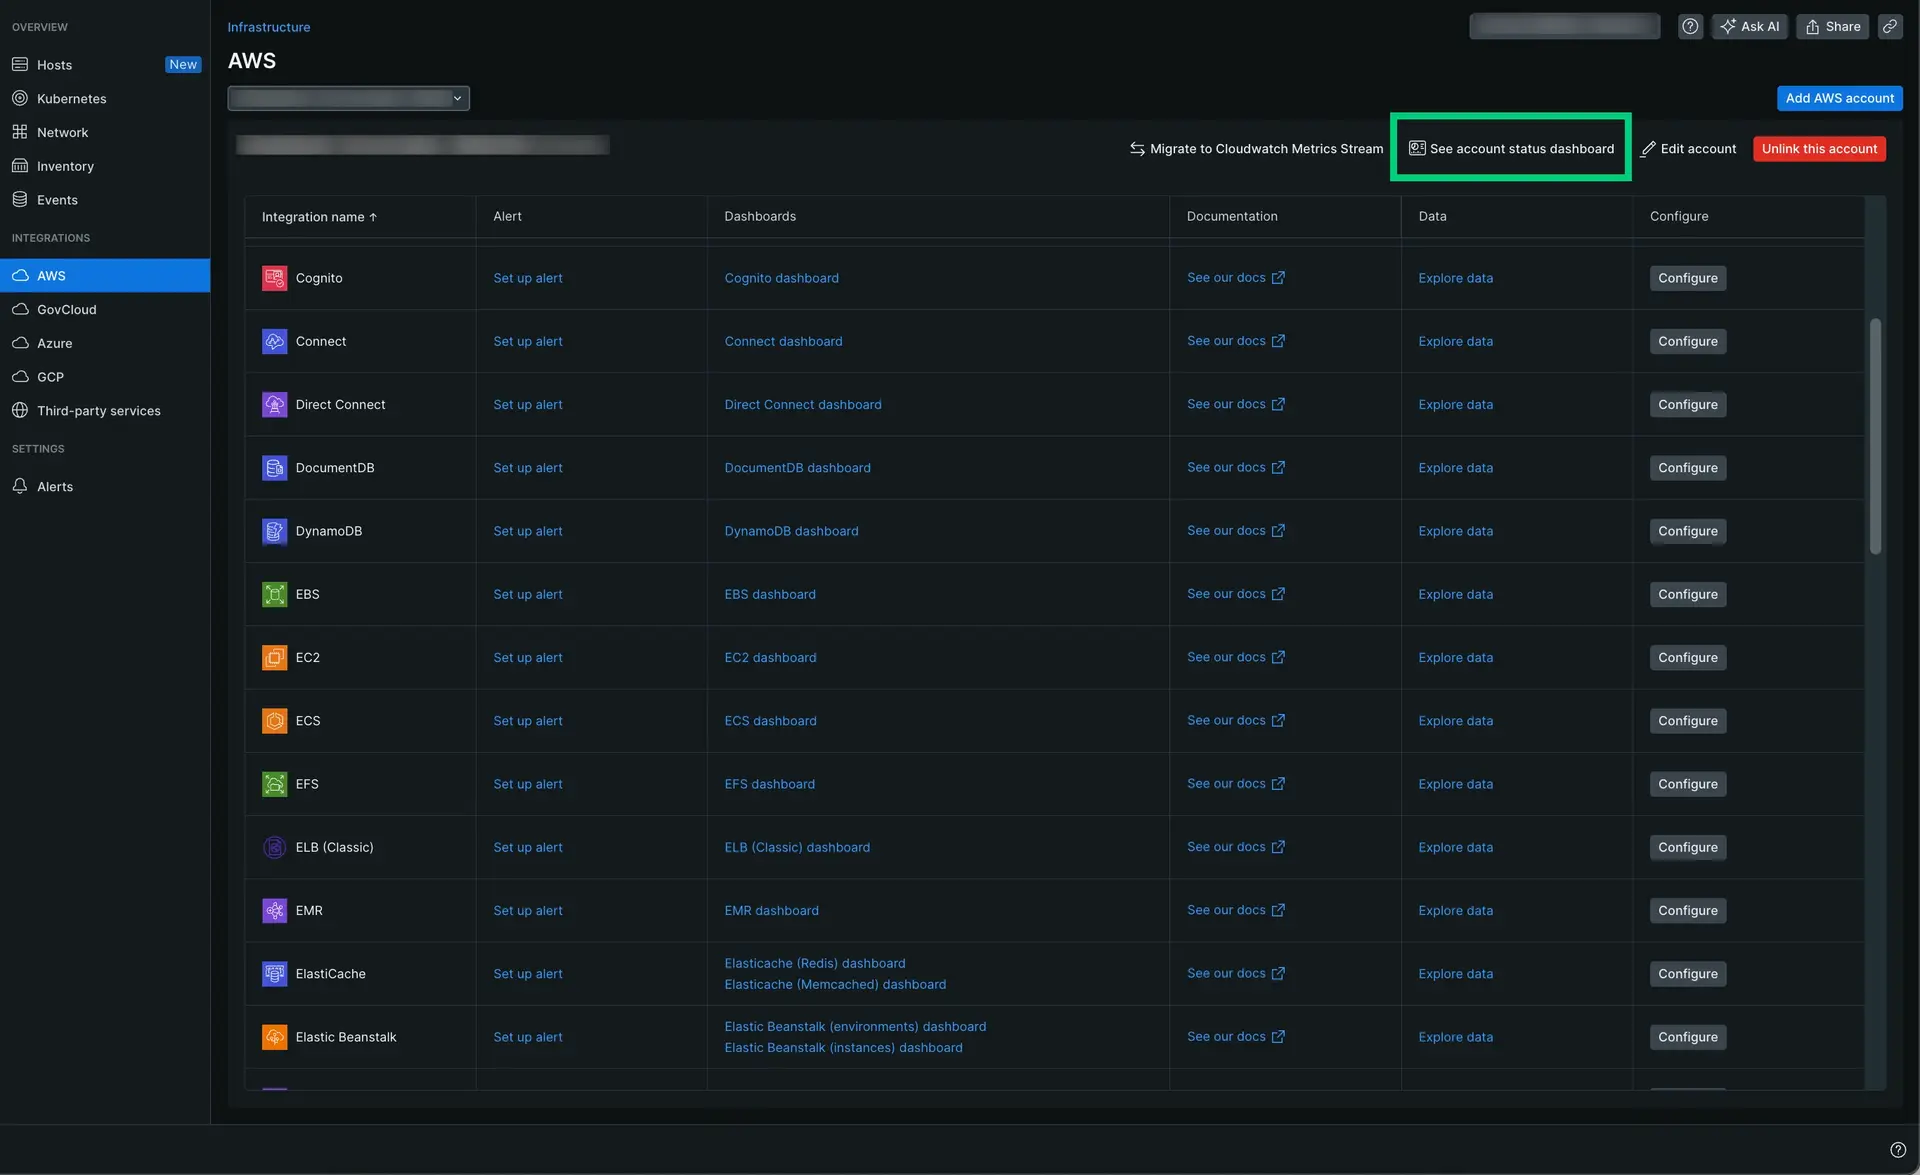
- Go to one.newrelic.com > Infrastructure.
- Select AWS.
- To view data for a specific integration, click Explore data next to it.
This opens the Data explorer where you can browse available metrics, facet, and filter by associated dimensions. You can also use the query builder tab.
Check the status of your account
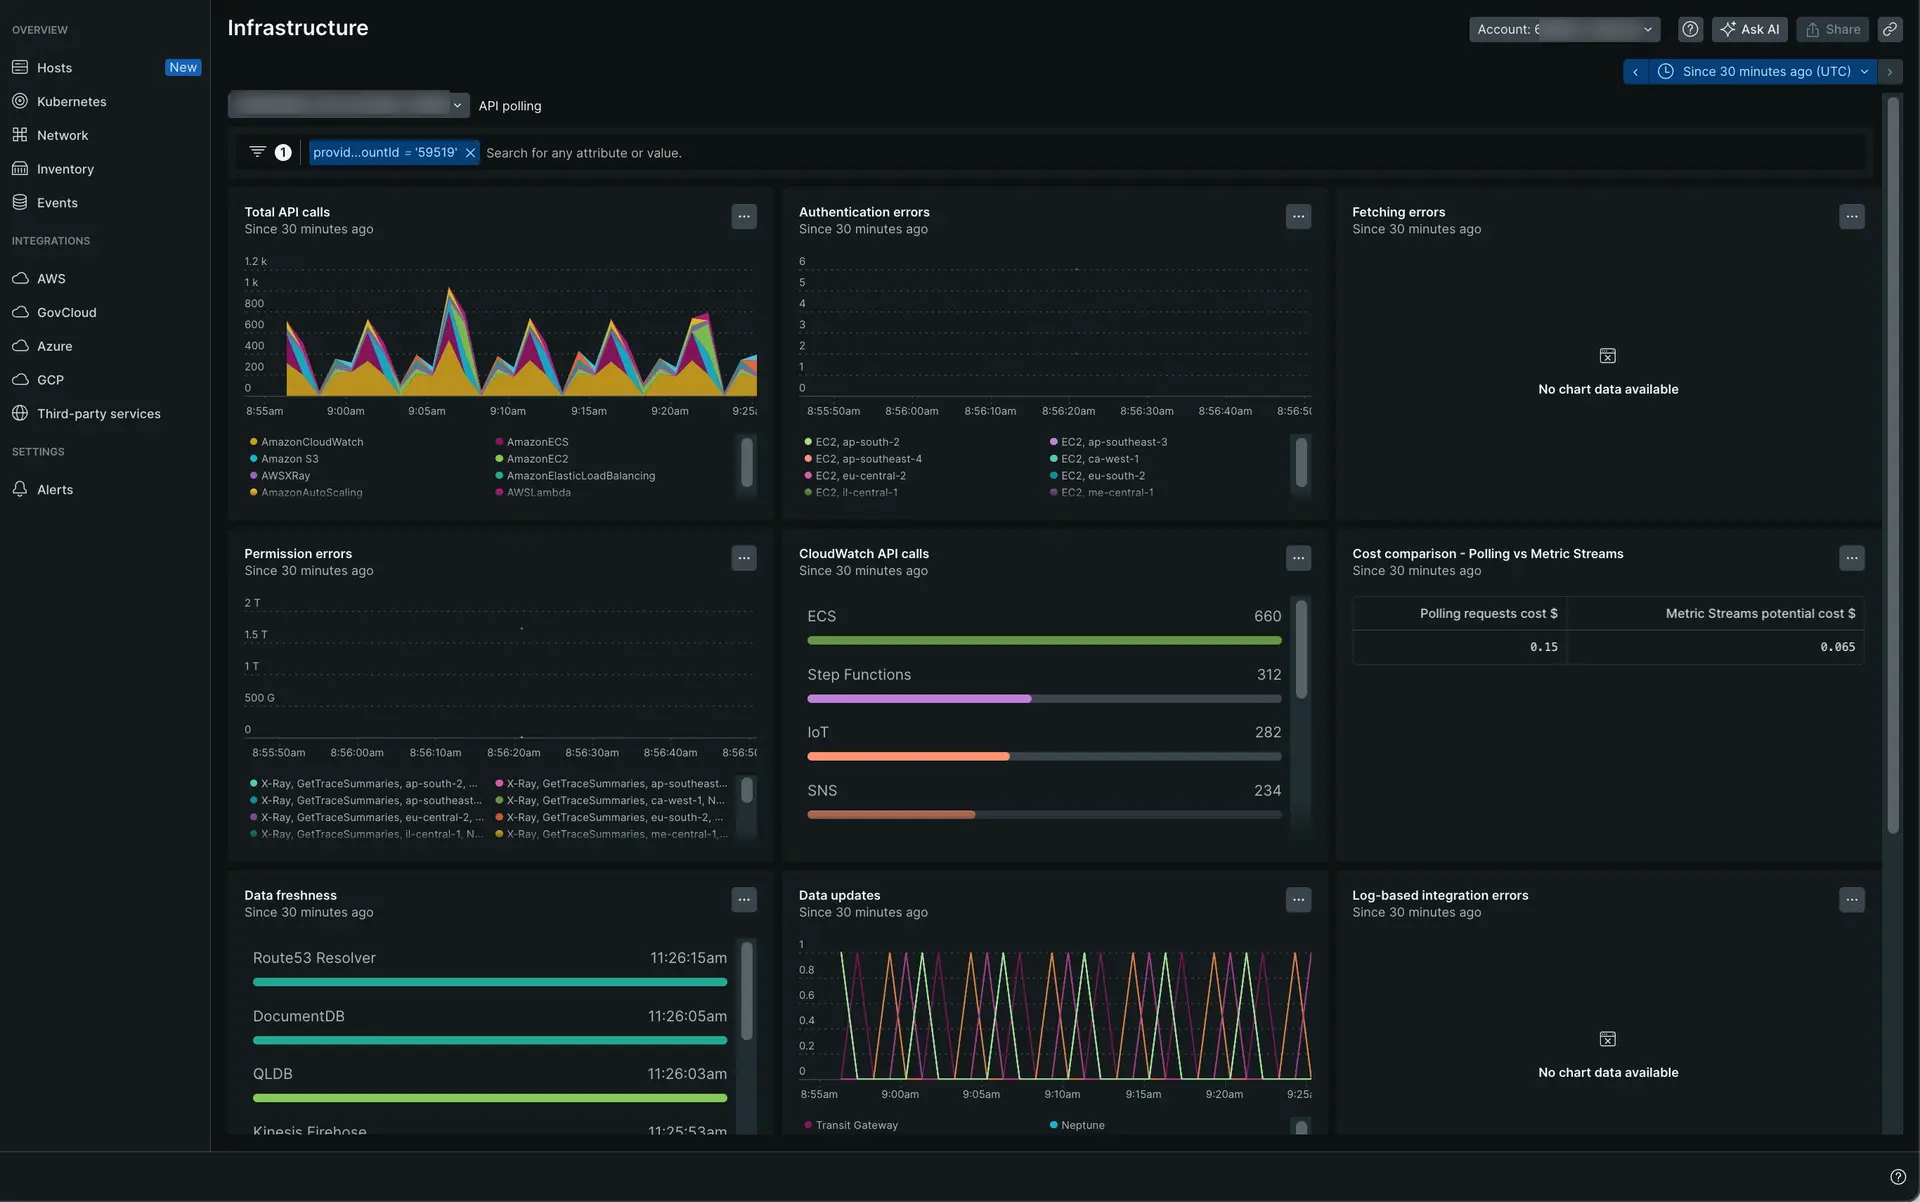
You can check the status of your account by clicking the See account status dashboard button.

Go to one.newrelic.com > Infrastructure. Under the Integrations section, click AWS. Then, click the See account status dashboard button.
Here's an example of the account status dashboard:

Related topics
AWS integrations metrics
Explore and understand metrics from CloudWatch Metric Stream.
Introduction to AWS integrations
Get an overview of AWS integrations and their capabilities.
Data explorer
Browse and visualize your AWS metrics data.
Polling intervals for AWS integrations
Understand data collection frequency for AWS integrations.