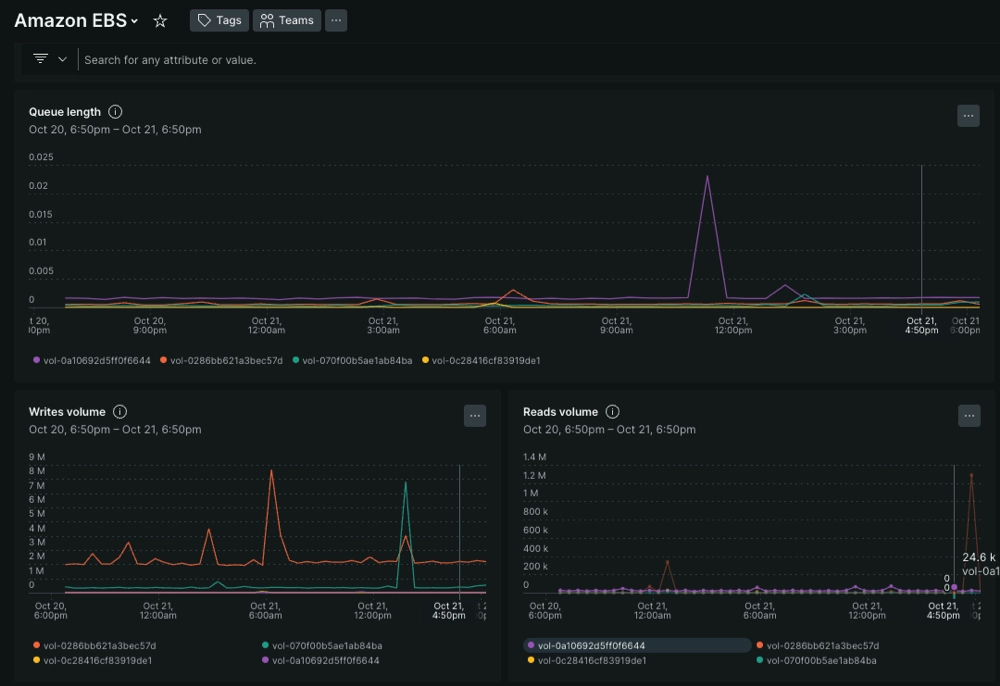
With the AWS Metric Streams integration, you only need a single service, AWS CloudWatch, to gather all AWS metrics and custom namespaces and send them to New Relic.
To stream CloudWatch metrics to New Relic:
- Check the minimal permissions and mapping instructions.
- Create Kinesis Data Firehose and point it to New Relic.
- Next, create a CloudWatch Metric Stream to send metrics to that Firehose you've just created.
- Follow the guided or manual setup instructions.
- Validate data reception.
If applicable, read our documentation about migrating from AWS polling integrations.
Tip
You can use Terraform to automate the process of enabling cloud integrations. Read how in the Terraform official documentation site.
Minimal permissions and mapping instructions
To enrich CloudWatch metrics with additional service metadata and custom tags, any AWS role configured in New Relic must be granted the following minimal permissions:
config:BatchGetResourceConfigconfig:ListDiscoveredResourceselasticache:DescribeCacheClusterstag:GetResources
The New Relic UI currently recommends the ReadOnlyAccess
policy over these individual items so that New Relic has proper permissions to collect service data that's not available in AWS CloudWatch Metric Streams.
New Relic and AWS accounts and regions mapping
- If you manage multiple AWS accounts, then each account needs to be connected to New Relic.
- If you manage multiple regions within those accounts, then each region needs to be configured with a different Kinesis Data Firehose pointing to New Relic.
- You will typically map one or many AWS accounts to a single New Relic account.
Guided setup using CloudFormation
First, you need to link each of your AWS accounts with your New Relic account. To do so, use either of these options:
- Go to one.newrelic.com > All capabilities > Infrastructure > AWS, click on Add an AWS account, then on Use metric streams, and follow the steps.
- Automate this step with NerdGraph.
Next, set up the metric stream using the CloudFormation template we provide in the last step of our UI. This template is provided as a base to set up the integration on a single region. You can customize and extend it to meet your requirements.
CloudFormation Template Parameters
This table outlines the various parameters required for the CloudFormation template. Since the template will create new resources in your AWS account, we don't providing names of existing AWS resources here.
Name | Description | Constraints |
---|---|---|
New Relic Ingest License Key | The associated with the account you wish to export metrics to. | 40-character hexadecimal string |
New Relic Datacenter | Identification of the New Relic data center your metrics are exported to. (EU data center accounts have license keys prefixed with | Allowed values: |
CloudWatch Metric Stream name | Name of new CloudWatch Metric Stream (must be unique per AWS account in the same AWS Region) | Must only container letters (uppercase and lowercase), numbers, and characters '_', and '-' with max length of 255 total characters |
Kinesis Data Firehose name | Name of new Kinesis Firehose Delivery Stream (must be unique per AWS account in the same AWS Region) | Must only container letters (uppercase and lowercase), numbers, and characters '.', '_', and '-' with max length of 64 total characters |
Firehose S3 backup bucket name | Name of new S3 Bucket Destination for failed events (must be globally unique across all AWS accounts in all AWS Regions within a partition) | Must adhere to the S3 bucket naming rules |
Enrich metrics with resource metadata from AWS Config | Enable and configure AWS Config to track resource changes. This allows you a complete monitoring New Relic experience. | Allowed values: |
Config S3 backup bucket name | Name of new S3 Bucket Destination for delivery channel configuration (must be globally unique across all AWS accounts in all AWS Regions within a partition) | Must adhere to the S3 bucket naming rules |
Tip
The provided CloudFormation template doesn't include any inclusion nor exclusion namespace filter in CloudWatch metric streams. Consider adapting the base template based on your business requirements.
Manual setup using AWS Console, API, or calls
Create a Kinesis Data Firehose Delivery Stream and configure the following destination parameters:
- Source: Direct PUT or other sources
- Data transformation: Disabled
- Record format conversion: Disabled
- Destination: New Relic
- Ensure the following settings are defined:
- New Relic configuration (Destination Settings)
- HTTP endpoint URL - US Datacenter:
https://aws-api.newrelic.com/cloudwatch-metrics/v1
- HTTP endpoint URL - EU Datacenter:
https://aws-api.eu01.nr-data.net/cloudwatch-metrics/v1
- API key: Enter your
- Content encoding:
GZIP
- Retry duration:
60
- HTTP endpoint URL - US Datacenter:
- S3 backup mode: Failed data only
- S3 bucket: select a bucket or create a new one to store metrics that failed to be sent.
- New Relic buffer conditions
- Buffer size:
1 MB
- Buffer interval:
60 (seconds)
- Buffer size:
- Permissions IAM role:
- Create or update IAM role
- New Relic configuration (Destination Settings)
Create the metric stream.
Go to CloudWatch service in your AWS console and select the Streams option under the Metrics menu.
Click Create metric stream.
Determine the right configuration based on your use cases:
- Use inclusion and exclusion filters to select which services should push metrics to New Relic.
- Select your Kinesis Data Firehose.
- Define a meaningful name for the stream (for example,
newrelic-metric-stream)
.
Change default output format to
Open Telemetry 0.7
. (JSON is not supported.)Confirm the creation of the metric stream.
Alternatively, you can find instructions on the AWS documentation to create the CloudWatch metric stream using a CloudFormation template, API, or the CLI.
Add the new AWS account in the Metric streams mode in the New Relic UI. Go to one.newrelic.com > All capabilities > Infrastructure > AWS, click on Add an AWS account, then on Use metric streams, and follow the steps.
Validate your data is received correctly
To confirm you're receiving data from the Metric Streams, follow these steps:
Go to one.newrelic.com > All capabilities > Infrastructure > AWS, and search for the Stream accounts.
Check the following:
- Account status dashboard. Useful to confirm that New Relic receives the metric data (errors, number of namespaces/metrics ingested, etc.)
- Explore your data. Use metrics and events to find a specific set of metrics, access all dimensions available for a given metric, and more.
It may take few minutes until new resources are detected and synthesized as entities. See cloud integrationssystem limits for more information.
Tip
AWS CloudWatch metrics for global services, such AWS Billing, are only availble in the us-east-1 region. Make sure there's an active CloudWatch metric stream configured in that region.
Queries, metric storage, and mapping
Metrics coming from AWS CloudWatch are stored as dimensional metrics of type summary
. You can query using NRQL.
We've mapped metrics from the current cloud integrations to the new mappings that will come from AWS Metric Streams. You can continue to use the current metric naming, and queries will continue to work and pick data from AWS Metric Streams, and the current cloud integrations.
Check our documentation on how current cloud integrations metrics map to the new metric naming.
All metrics coming from the metric stream have these attributes:
aws.MetricStreamArn
collector.name = 'cloudwatch-metric-streams'
.
AWS namespaces' entities in the entity list
We generate New Relic entities for many AWS namespaces. When we generate New Relic entities for a namespace you can expect to:
- Browse those entities in our entity explorer.
- Access an entity dashboard automatically created for those entities.
- Get metrics and entities from that namespace decorated with AWS tags. Collecting AWS tags requires that you have given New Relic the
tag:GetResources
permission, which is part of the setup process in the UI. AWS tags show in metrics astag.AWSTagName
; for example, if you have set aTeam
AWS tag on the resource, it will show astag.Team
. - Leverage all the features included in the entity explorer.
Important
New Relic Lookout is not compatible with the AWS Metric Streams integration.
Set alert conditions
You can create NRQL alert conditions on metrics from a metric stream. Make sure your filter limits data to metrics from the CloudWatch metric stream only. To do that, construct your queries like this:
SELECT sum(aws.s3.5xxErrors) FROM Metric WHERE collector.name = 'cloudwatch-metric-streams' FACET aws.accountId, aws.s3.BucketName
Then, to make sure that processes the data correctly, configure the advanced signal settings. These settings are needed because AWS CloudWatch receives metrics from services with a certain delay. (For example, Amazon guarantees that 90% of EC2 metrics are available in CloudWatch within 7 minutes of them being generated.) Moreover, streaming metrics from AWS to New Relic adds up to 1 minute additional delay, mostly due to buffering data in the Firehose.
To configure the signal settings, under Condition Settings, click on Advanced Signal Settings and enter the following values:
- Aggregation window. We recommend setting it to 1 minute. If you're having issues with flapping alerts or alerts not triggering, consider increasing it to 2 minutes.
- Offset evaluation by. Depending on the service, CloudWatch may send metrics with a certain delay. The value is set in windows. With a 1-minute aggregation window, setting the offset to 8 ensures the majority of the metrics are evaluated correctly. You may be able to use a lower offset if the delay introduced by AWS and Firehose is less.
- Fill data gaps with. Leave this void, or use Last known value if gaps in the data coming from AWS lead to false positives or negatives.
See our documentation on how to create NRQL alerts for more details.
Tags collection
New Relic provides enhanced dimensions from metrics coming from AWS CloudWatch metric streams. Resource and custom tags are automatically pulled from most services and are used to decorate metrics with additional dimensions. Use metrics and events to see which tags are available on each AWS metric.
The following query shows an example of tags being collected and queried as dimensions in metrics:
SELECT average(`aws.rds.CPUUtilization`) FROM Metric FACET `tags.mycustomtag` SINCE 30 MINUTES AGO TIMESERIES
Not all metrics have their custom tags as dimensions. Only metrics linked to entities listed in the entity explorer have their custom tags associated. The AWS CloudWatch metric stream doesn't include tags as part of the stream message; hence, additional processing is required on the New Relic side.
Metadata collection
Like with custom tags, New Relic also pulls metadata information from relevant AWS services in order to decorate AWS CloudWatch metrics with enriched metadata collected from AWS Services APIs. This metadata is accessible in New Relic as additional dimensions on the metrics provided by AWS CloudWatch.
Important
This optional capability is complementary to the CloudWatch Metric Streams integration. Your service discovery and monitoring will be incomplete if you don't enable this optional capability.
The solution relies on AWS Config, which might incur in additional costs in your AWS account. AWS Config provides granular controls to determine which services and resources are recorded. New Relic will only ingest metadata from the available resources in your AWS account.
The following services and namespaces are supported:
- ALB/NLB
- API Gateway (excluding API v1)
- DynamoDB
- EBS
- EC2
- ECS
- ELB
- Lambda
- RDS
- S3
Infrastructure agent metrics and EC2 metadata decoration
As with the EC2 API polling integration, when the infrastructure agent is installed on a host and the EC2 namespace is active via AWS CloudWatch metric stream integration, then all the infrastructure agent events and metrics are decorated with additional metadata.
The following attributes will decorate infrastructure samples. Some of these may not be applicable on all environments: awsAvailabilityZone
, ec2InstanceId
, ec2PublicDnsName
, ec2State
, ec2EbsOptimized
, ec2PublicIpAddress
, ec2PrivateIpAddress
, ec2VpcId
, ec2AmiId
, ec2PrivateDnsName
, ec2KeyName
, ec2SubnetId
, ec2InstanceType
, ec2Hypervisor
, ec2Architecture
, ec2RootDeviceType
, ec2RootDeviceName
, ec2VirtualizationType
, ec2PlacementGroupName
, ec2PlacementGroupTenancy
.
Custom metrics and percentiles
The CloudWatch metric stream integration automatically ingests new metrics configured in the stream, including custom metrics and percentiles.
Custom metrics
To ingest CloudWatch custom metrics, make sure your custom namespace is visible in the CloudWatch metric stream configuration and it's not being filtered by inclusion or exclusion rules.
Percentiles
AWS CloudWatch allows you to define additional statistics, including percentiles.
Follow these steps to add percentiles to any metric available in the CloudWatch stream:
On AWS, update the CloudWatch stream configuration (via API, CLI, or AWS Console) with the required percentiles in the
StatisticConfiguration
setting. For example, you can add p90, p95, and p99 percentiles to theELB latency metric (aws.elb.Latency)
.After a few minutes, the new statistic should be made available in the stream and ingested by New Relic. Percentiles can be queried using this naming convention:
From Metric select max(aws.elb.Latency.p99) where collector.name = 'cloudwatch-metric-streams' timeseries
Although AWS supports other statistics in the stream beyond percentiles, those aren't made available in the Open Telemetry export format (only JSON) and are currently not supported by New Relic.
Learn more about pricing, limitations, and advance configurations from the AWS documentation.
Manage your data
The New Relic UI provides a set of tools to keep track of the data being ingested in your account. Go to Manage your data in the settings menu to see all details. Metrics ingested from AWS Metric Streams integrations are considered in the Metric bucket.
If you need a more granular view of the data, use the bytecountestimate()
function on Metric
to estimate the data being ingested. For example, the following query represents data ingested from all metrics processed via AWS Metric Streams integration in the last 30 days (in bytes):
FROM Metric SELECT bytecountestimate()/10e8 as 'GB Estimate' WHERE collector.name='cloudwatch-metric-streams' SINCE 30 day ago
To see data ingested by AWS service/namespace:
FROM Metric SELECT bytecountestimate()/10e8 as 'GB Estimate' WHERE collector.name='cloudwatch-metric-streams' FACET aws.Namespace
To see number of raw metric updates processed by AWS service/namespace:
FROM Metric SELECT dataPointCount() WHERE collector.name='cloudwatch-metric-streams' FACET aws.Namespace
We recommend the following actions to control the data being ingested:
- Make sure metric streams are enabled only on the AWS accounts and regions you want to monitor with New Relic.
- Use the inclusion and exclusion filters in the CloudWatch Metric Streams in order to select which services or namespaces are being monitored by New Relic.
- Consider using drop data rules to discard metrics based on custom filters. (For example, drop metrics by namespace and tag, tag value, or any other valid NRQL criteria.)
Important
Metrics sent via AWS Metric Streams count against your Metric API limits for the New Relic account where data will be ingested.