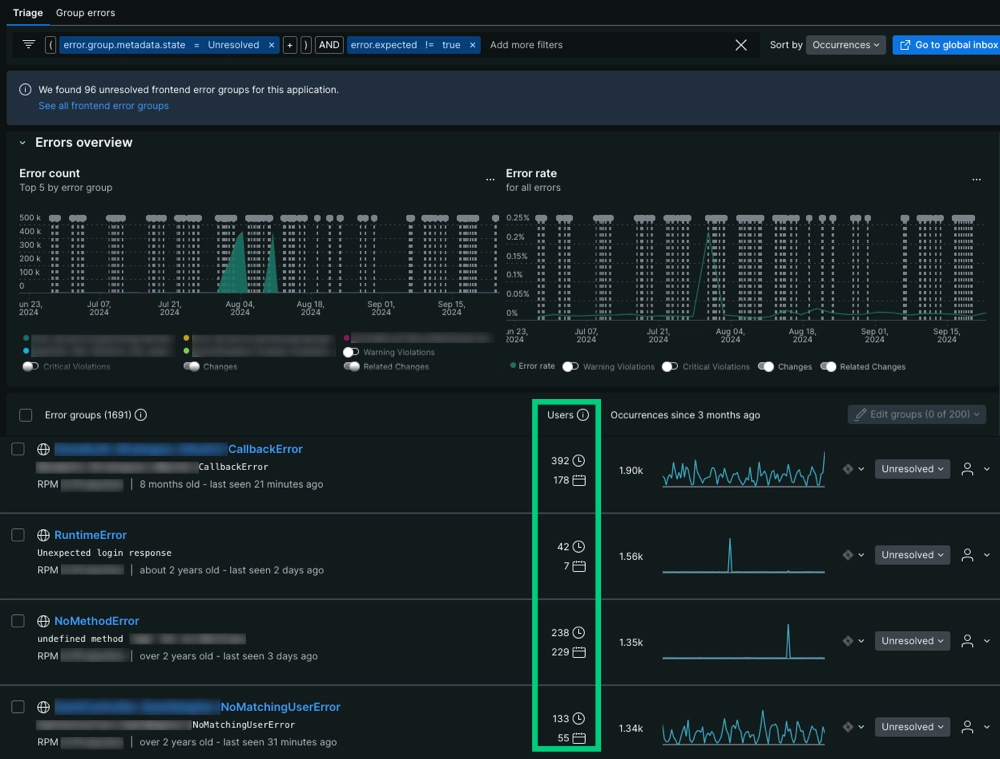
New Relic agents automatically capture data about the scope of errors affecting your applications. When you organize by error group, you can see the impact through three key metrics:
- Users impacted: The number of unique users affected by errors
- Sessions impacted: The number of unique browser sessions affected (fallback for browser entities)
- Devices impacted: The number of unique mobile devices affected (fallback for mobile entities)
When users impacted data isn't available, New Relic automatically displays the appropriate fallback metric based on your entity type. This helps you prioritize where to focus your debugging efforts by showing you the errors with the highest scope of impact.

Go to one.newrelic.com > APM & Services > Errors (errors inbox) > Triage: You can find impact metrics in the second column of the Error groups table, located beneath the Error count and Error rate time series.
Fallback impact metrics
New Relic prioritizes showing the most relevant impact data for your specific application type. When Users impacted data isn't available, the system automatically falls back to entity-specific metrics:
- Browser entities: Displays Sessions impacted - the number of unique browser sessions affected by errors
- Mobile entities: Displays Devices impacted - the number of unique mobile devices affected by errors
These fallback metrics are automatically collected without requiring additional configuration, unlike Users impacted which may need custom attributes. This ensures you always have visibility into the scope of errors affecting your applications, regardless of your setup.
Custom attributes to track users impacted
In some cases, an error event may not have attributes that identify the end user affected by that error event. You can manually add custom attributes so our agents capture user-identifying metadata at the time of ingest.
For cases where you need to add a custom attribute, we recommend reviewing OpenTelemetry's attribute conventions because there are multiple common conventions for naming end user attributes.
For example, OpenTelemetry standards uses the following attributes in order of priority:
userIduser
You can review how New Relic processes custom attributes by reading our doc about collecting custom events.
Query for impact metrics
Impact metrics for error groups are recorded as Metric data types with specific metric names:
Alert on impact metrics
By creating an NRQL alert condition, developers can trigger when the scope of errors exceeds a threshold. You can create alerts for any of the impact metrics:
- Users impacted: Alert when user impact exceeds your threshold
- Sessions impacted: Alert when browser session impact exceeds your threshold
- Devices impacted: Alert when mobile device impact exceeds your threshold
Creating this alert requires determining the NRQL query which measures the amount of users impacted in a way which best captures your use case.
As an example, the following NRQL query measures the amount of unique users which have been impacted by an error group coming from a specific entity:
Once you have decided on a NRQL query, it can be used to create a NRQL alert condition.
To improve the signal to noise ratio of your triggered alerts see alert creation tips, how alert thresholds are evaluated, and alert condition examples.
Set users impacted with setUser method
You can use an agent method to identify an end user for the Users impacted metric. Sessions and devices impacted are automatically collected without additional configuration. See implementation details for each agent below:
Agent | Method to identify an end user |
|---|---|
Browser | |
Go | |
Java | |
Mobile | |
.NET | |
Node.js | |
PHP | |
Python | |
Ruby |