lab
This procedure is part of a lab that teaches you how to troubleshoot your web app with New Relic .
Each procedure in the lab builds upon the last, so make sure you've completed the last procedure, Debug errors in your application, before starting this one.
After fixing JavaScript errors in your application, you and your team are feeling confident. Ready for your down time, you head over to social media but you check Twitter and see some confused customers:

Uh oh! You customers don't look happy. It's time to use New Relic browser monitoring to discover the source of delay.
Important
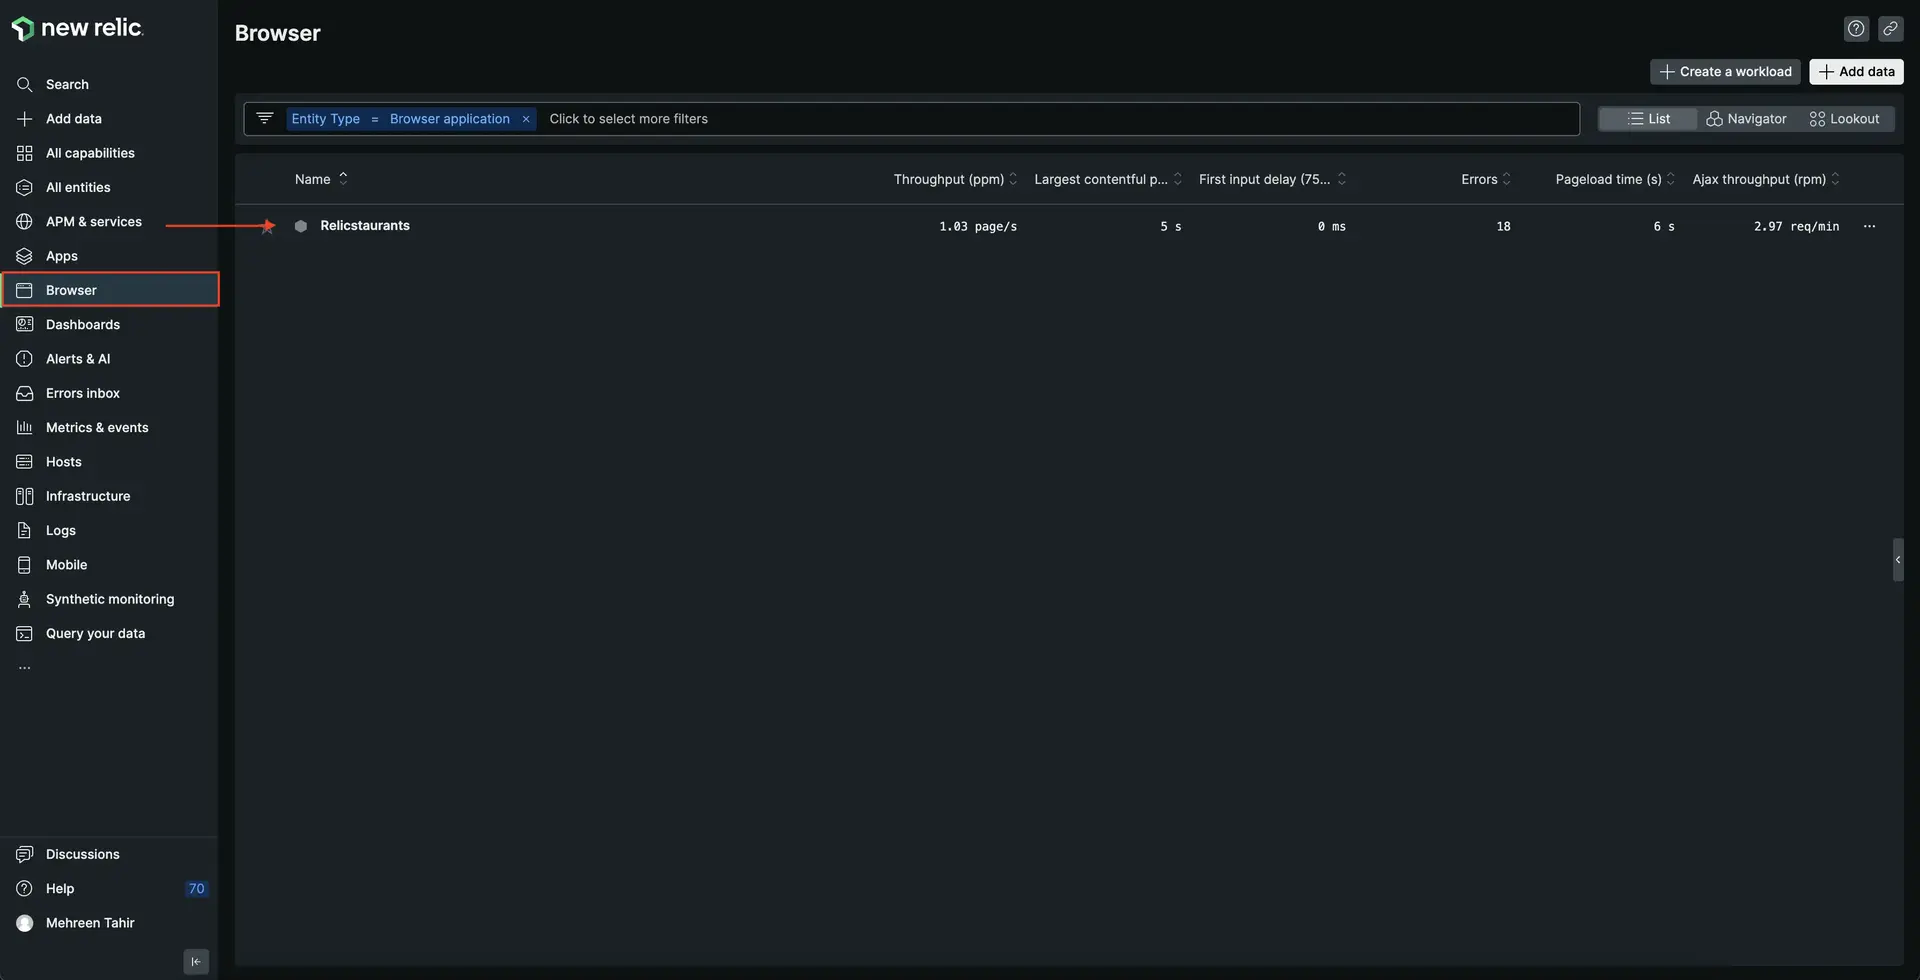
In order to see your data in New Relic, you need to enable browser monitoring for this procedure.
If you haven't already, instrument your app with our browser agent.
Debug slowness in your application
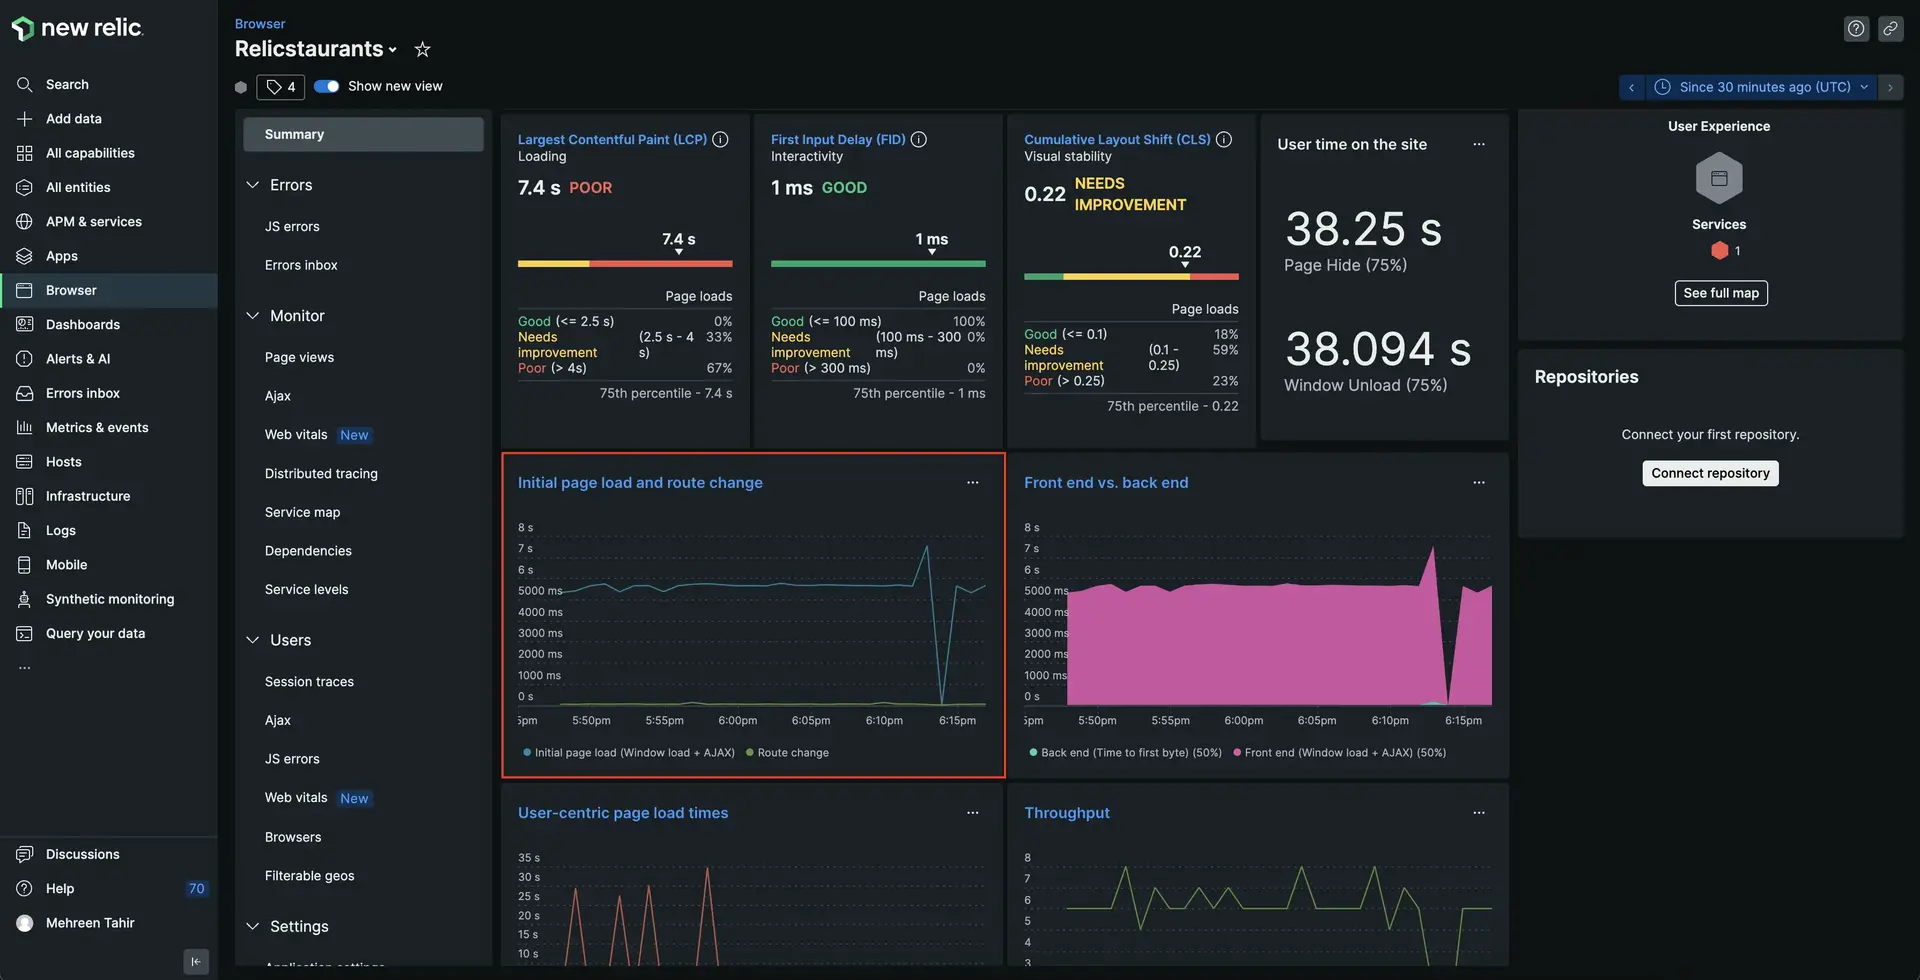
Here, you see all the data related to your browser application including Page views with JavaScript errors, Core web vitals, User time on the site, Initial page load and route changes, and others.
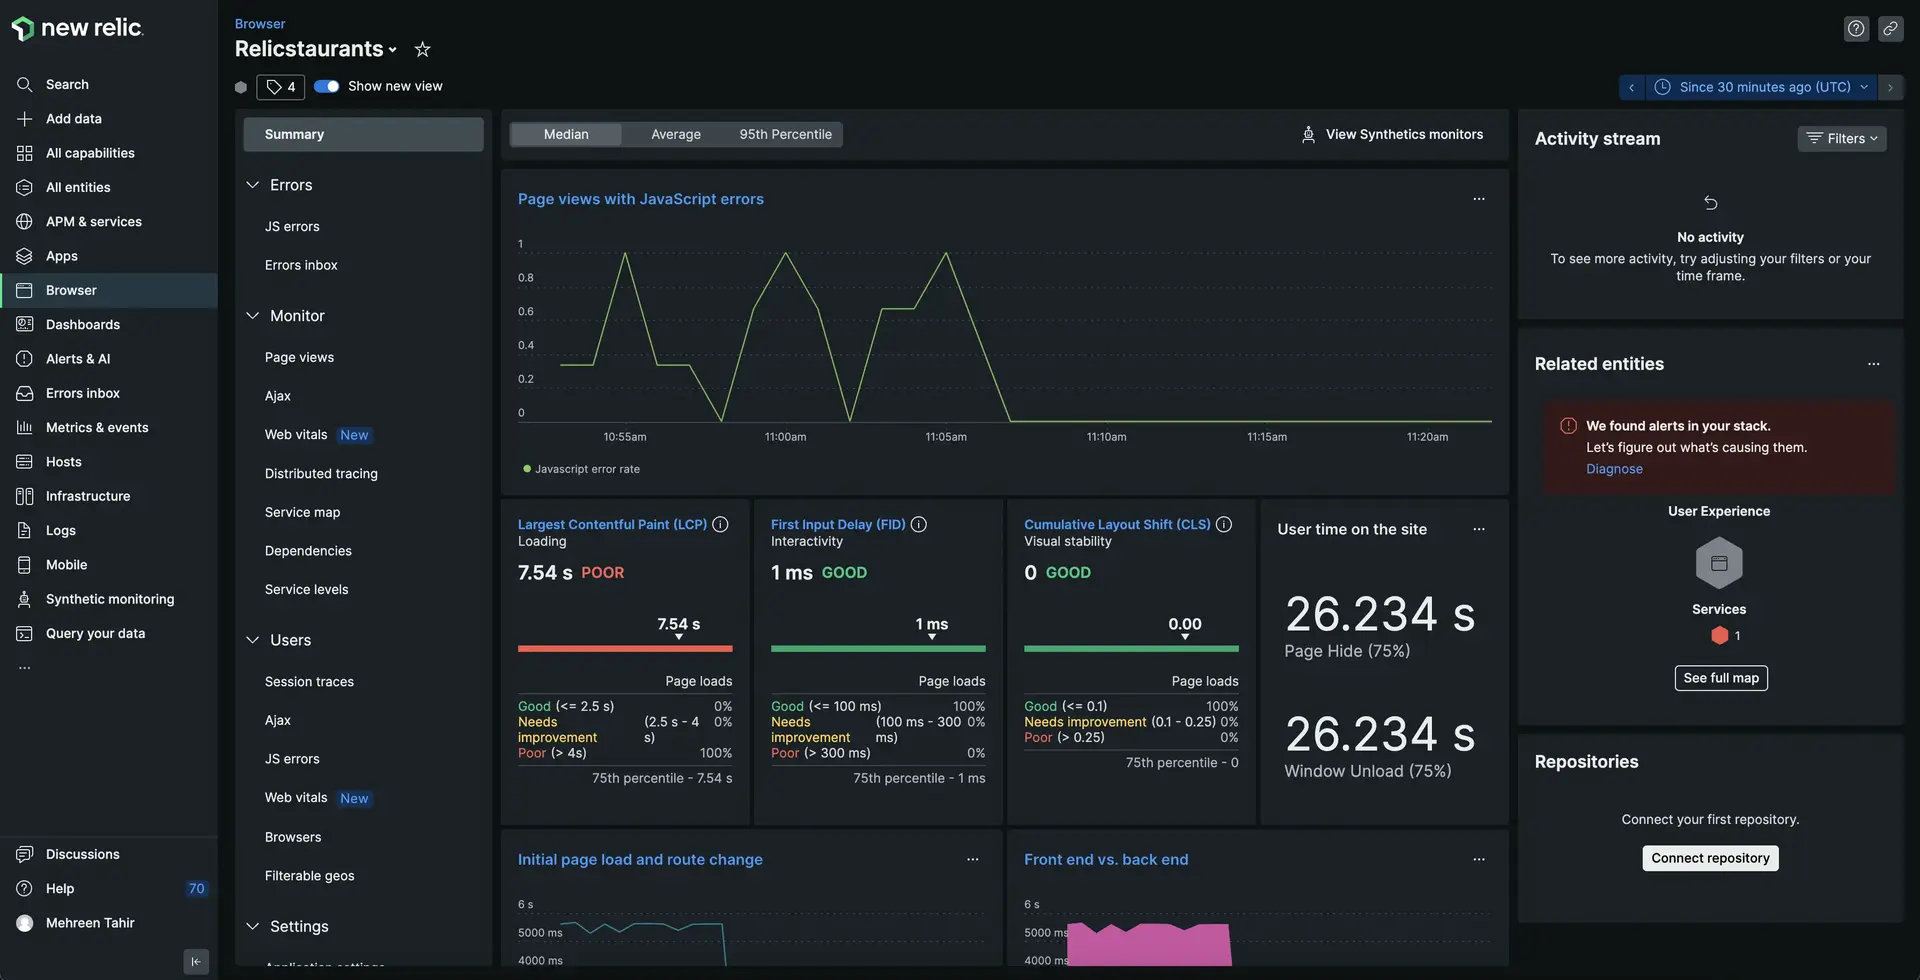
Notice the largest contentful paint (LCP).
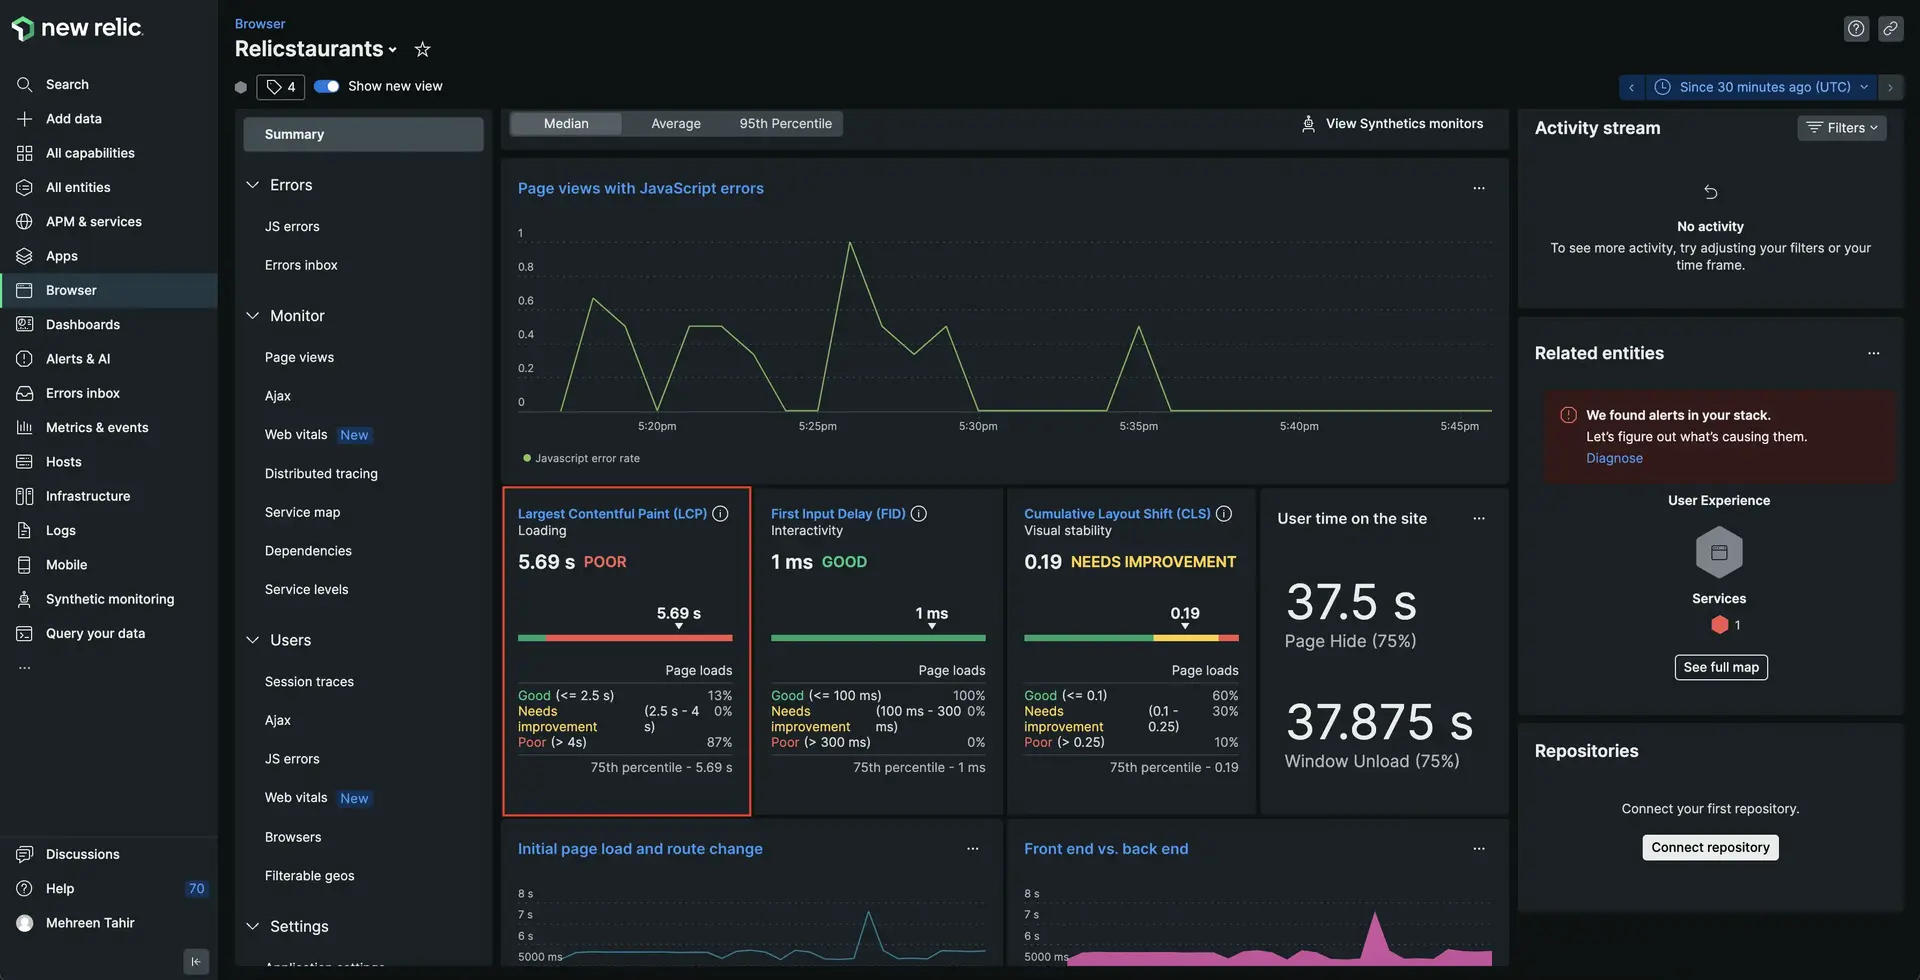
Largest contentful paint (LCP) represents how quickly the main content of a web page is loaded. Ideally, the content should not take more than a second or two to load. Here, you see that your site is loading in more than 5 seconds. No wonder your users are complaining!
But what's causing this delay? back end?
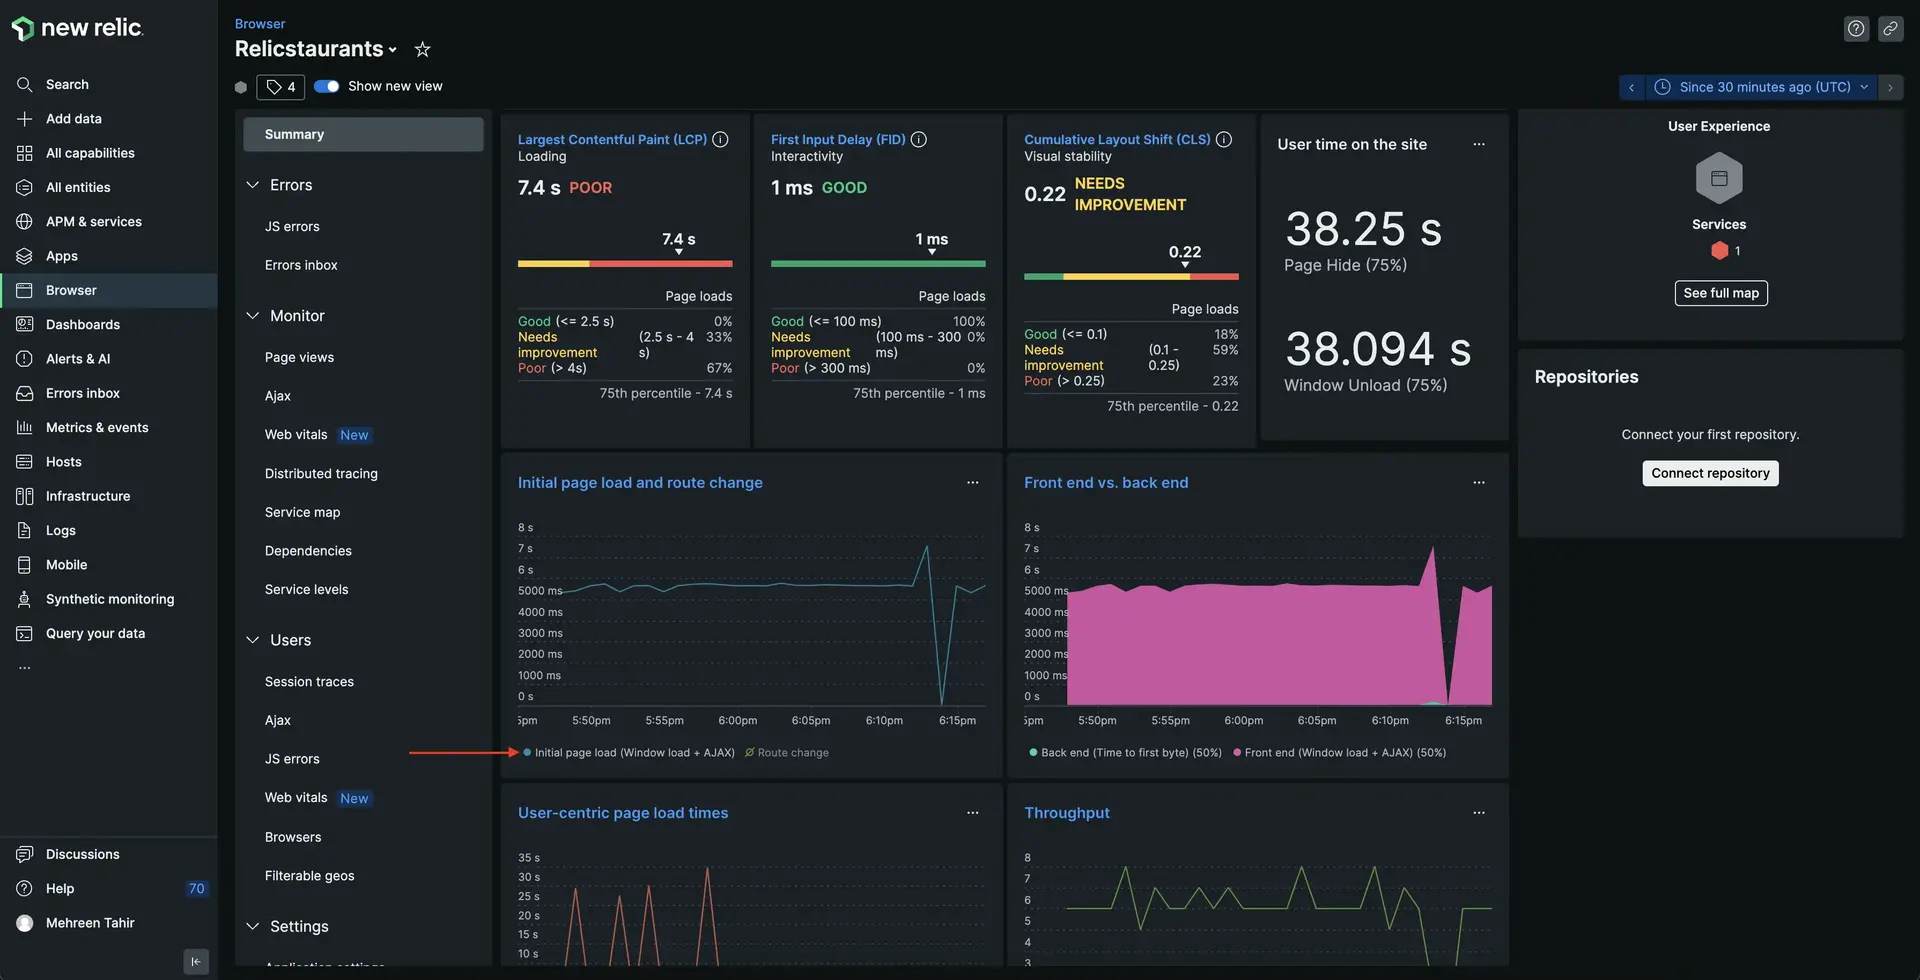
Scroll down and notice the Front end vs. back end graph.
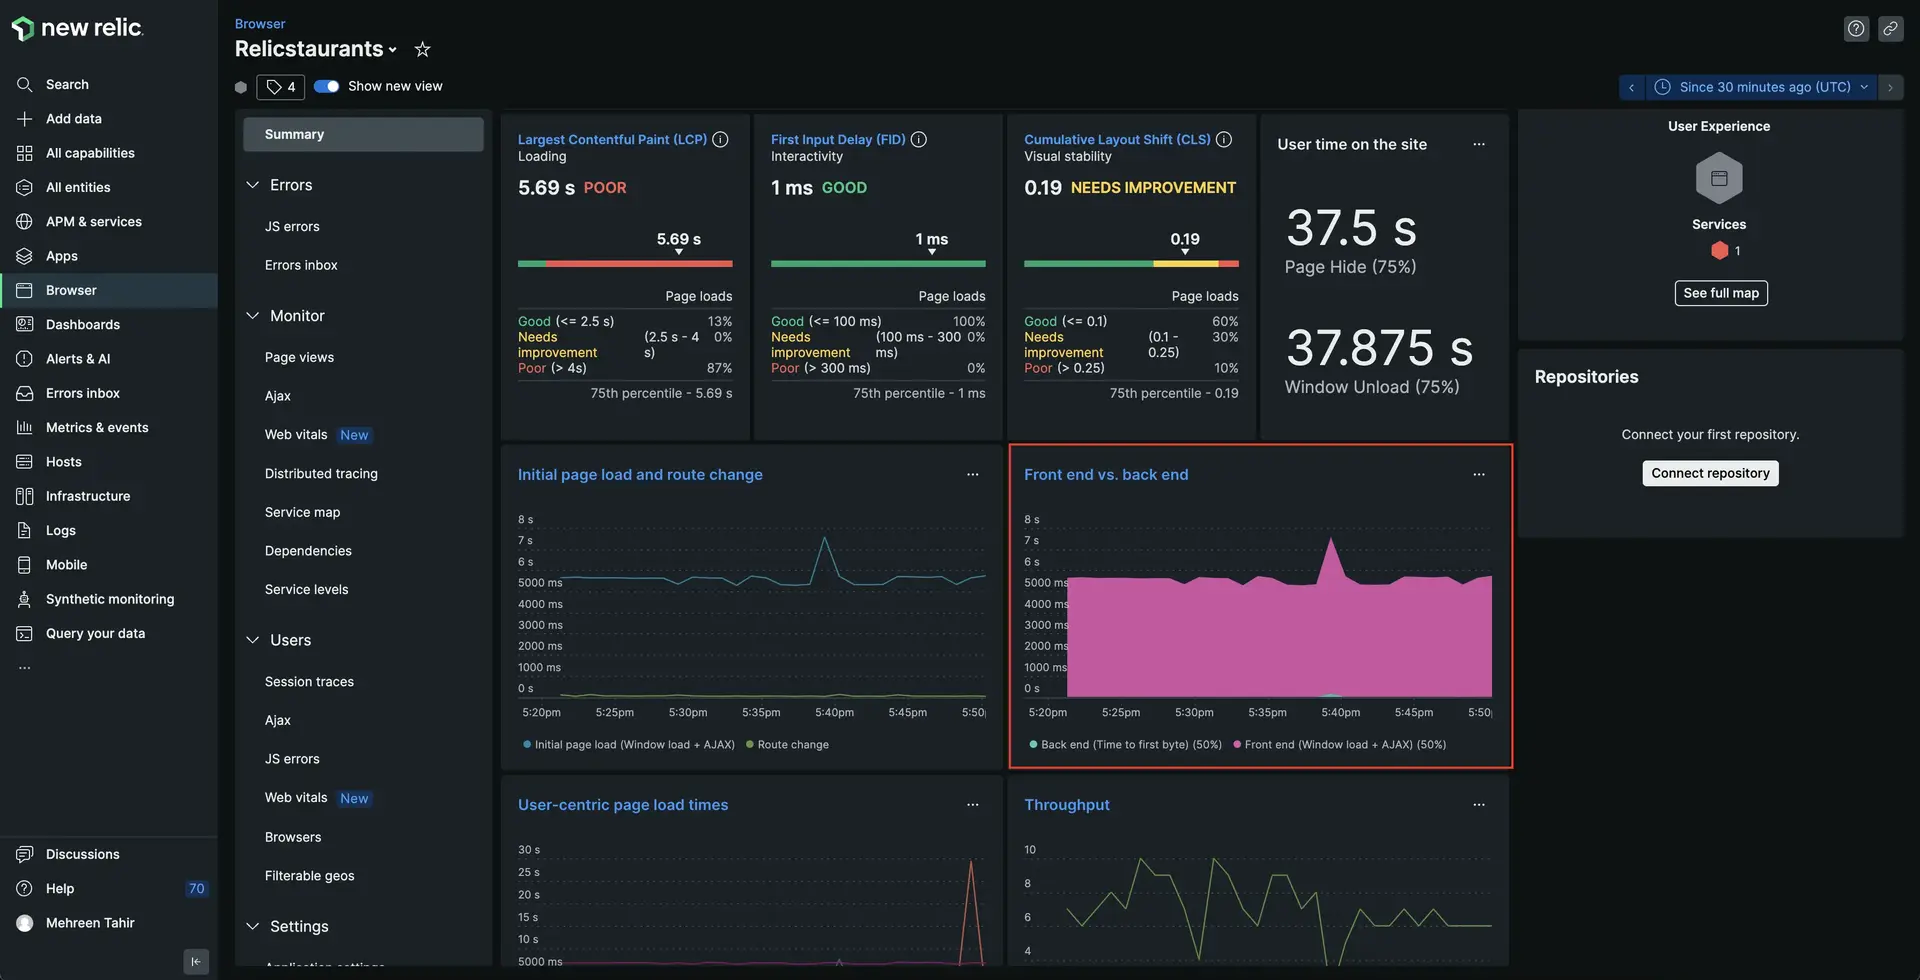
Click on Back end (time to first byte) (50%) to filter the graph and see how long backend takes to load.
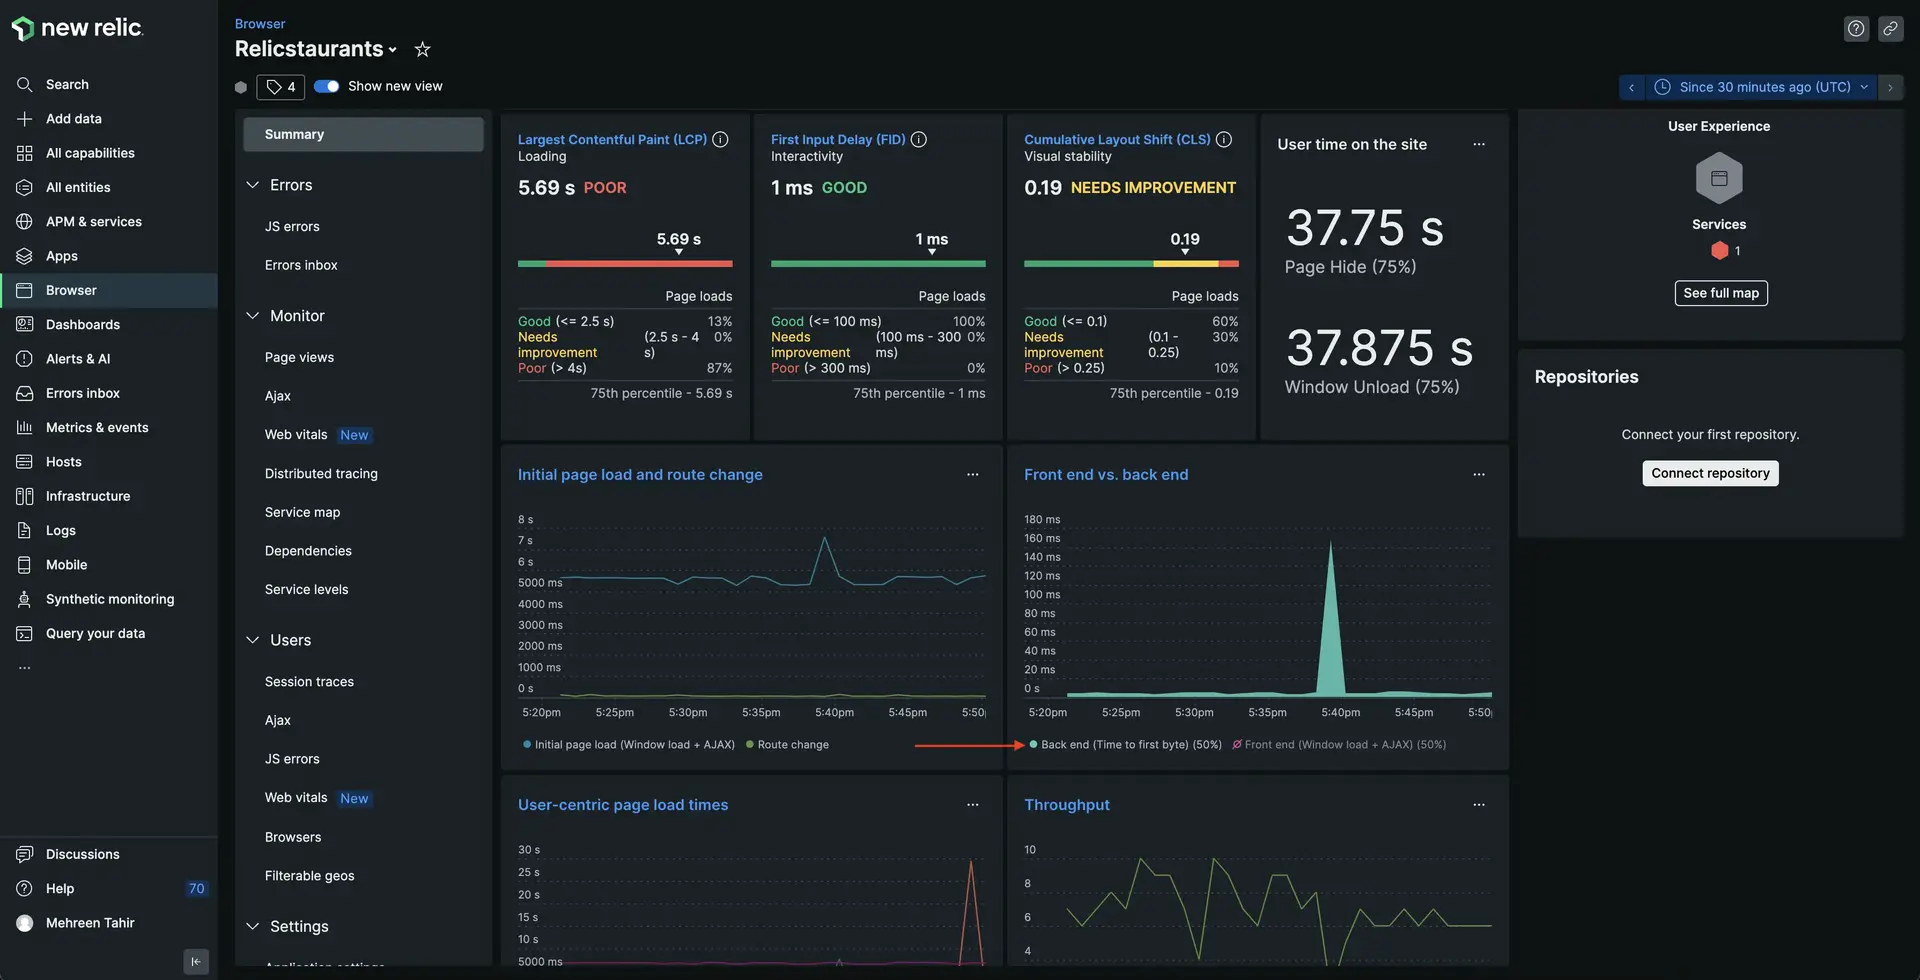
The graph indicates that the back end took maximum 140 milliseconds to process the request in worst case. Does this mean your front end is causing delay?
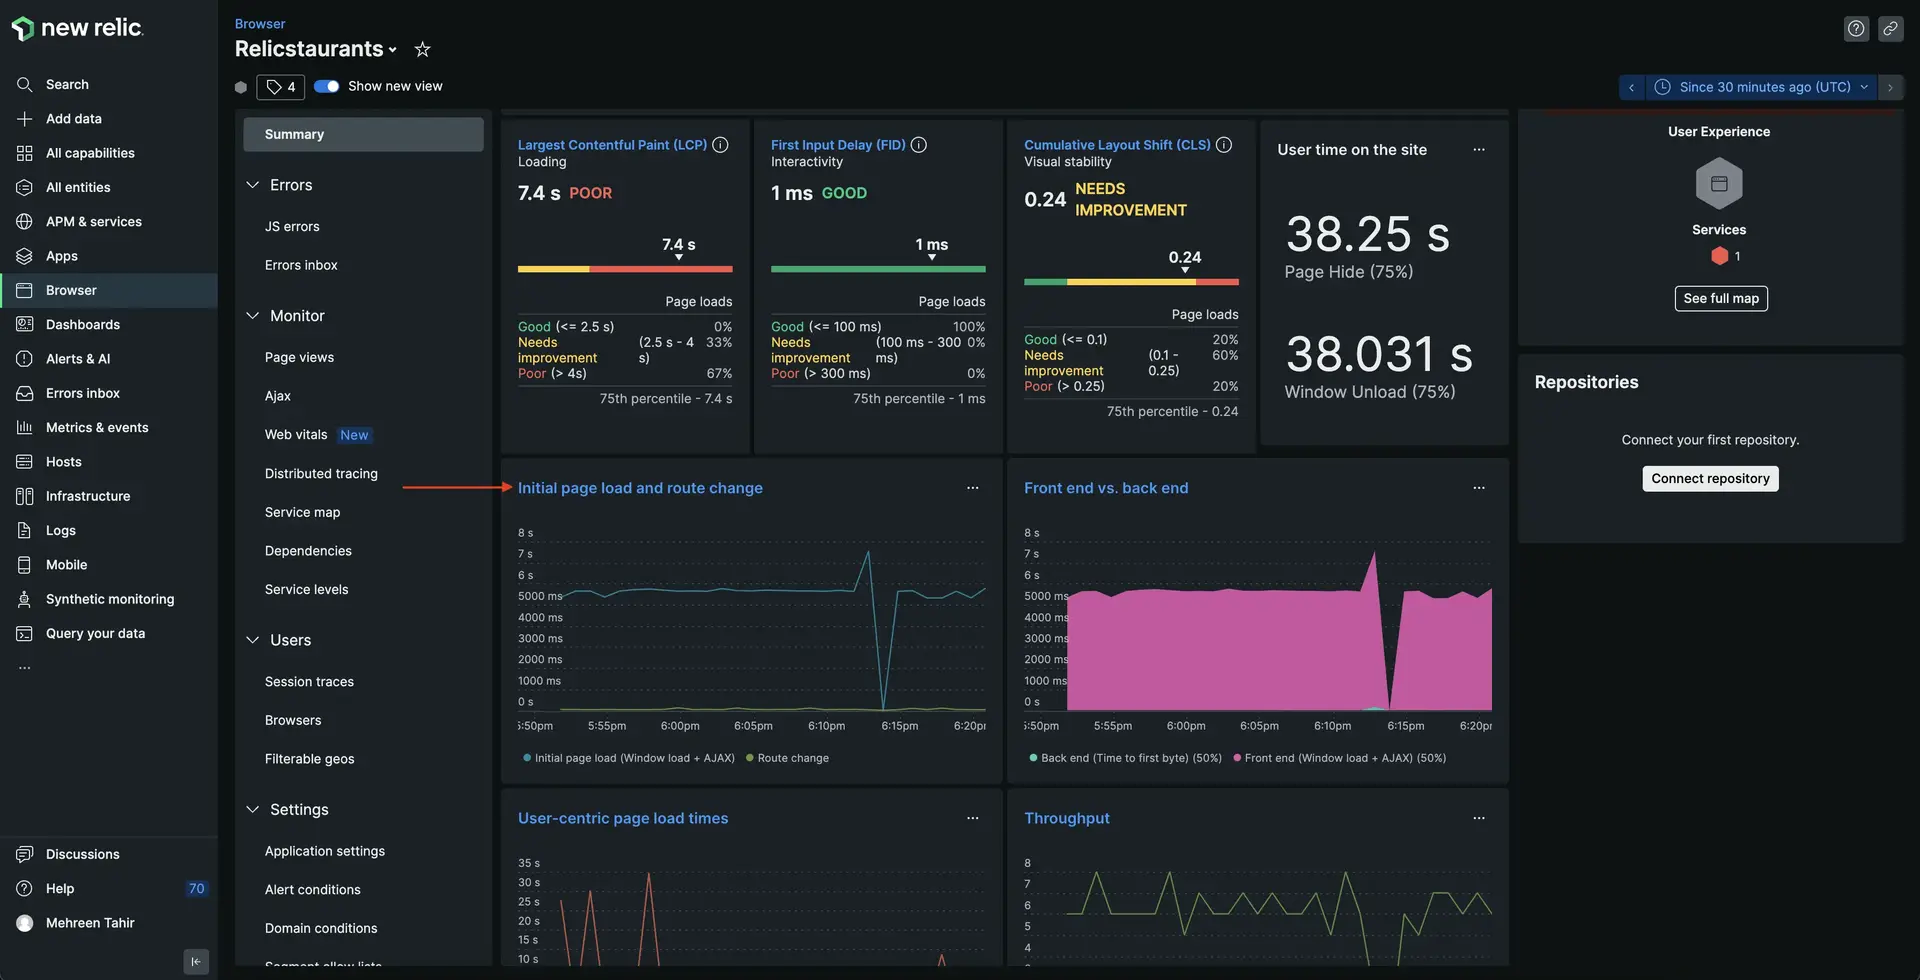
Click on Front end (Window load + AJAX) (50%).
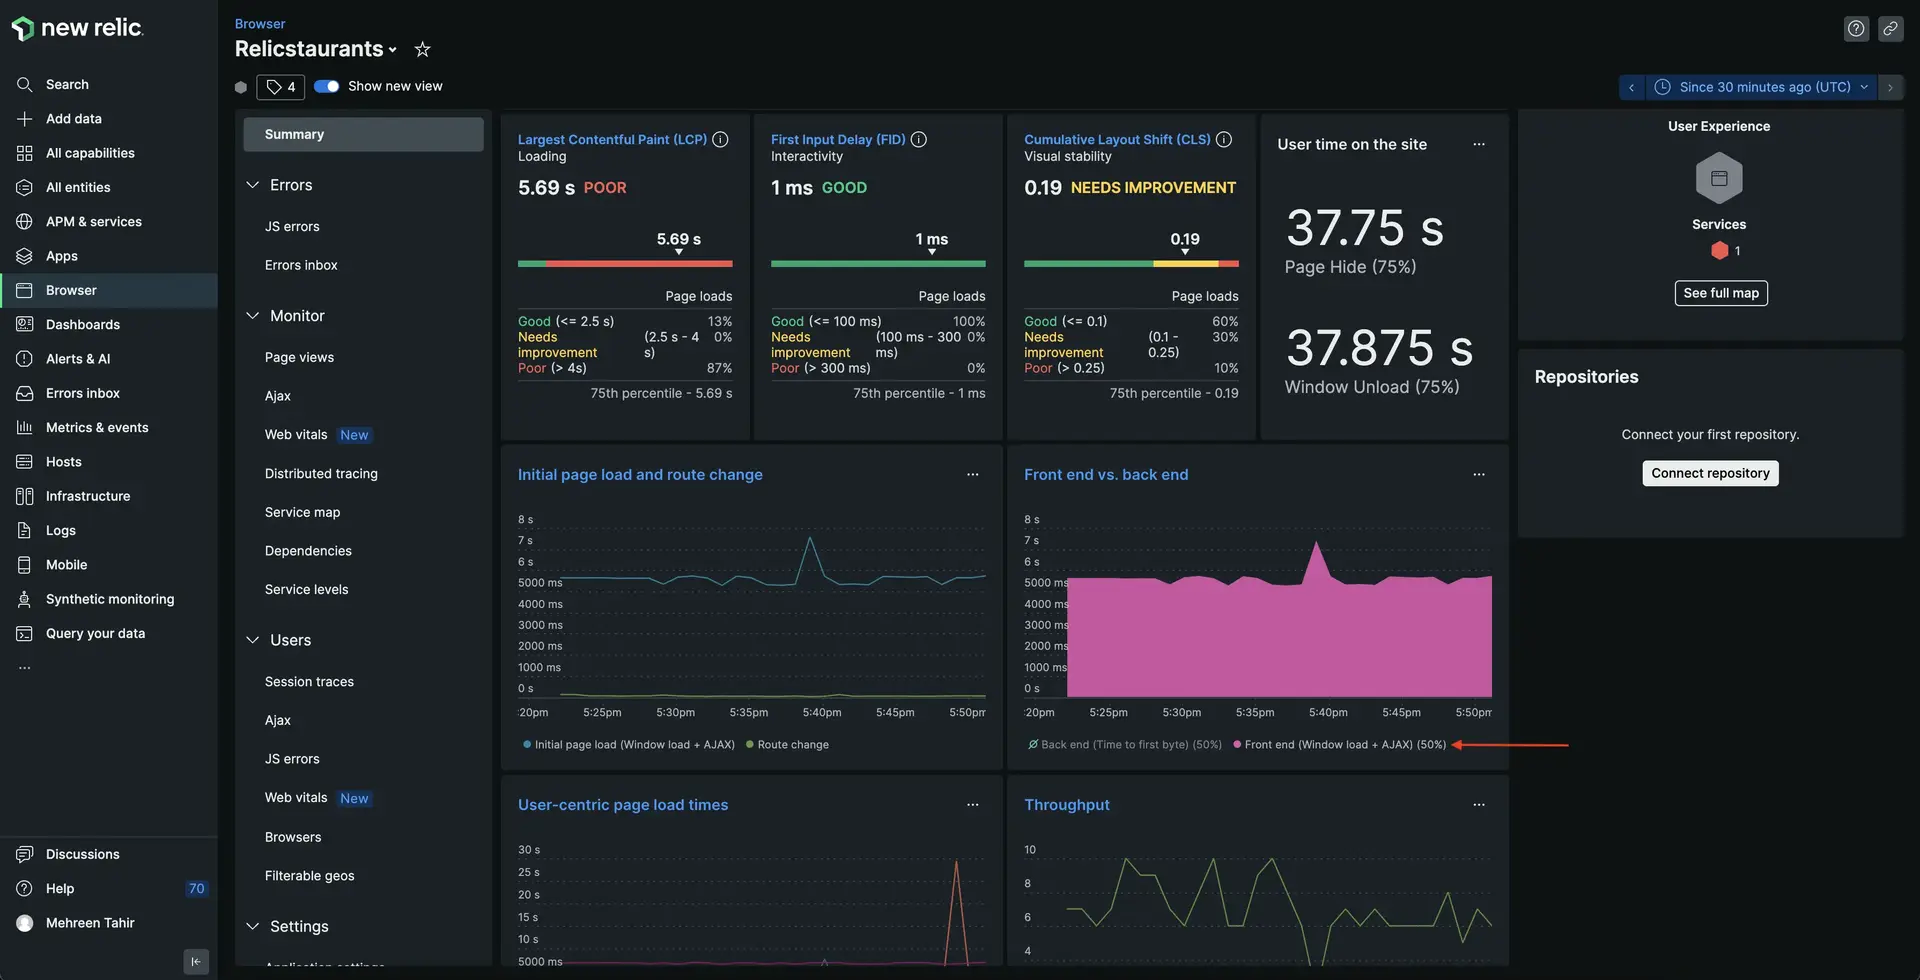
There's the problem! The graph indicates that the delay is happening on front end.
Sort the pages by Most time-consuming.
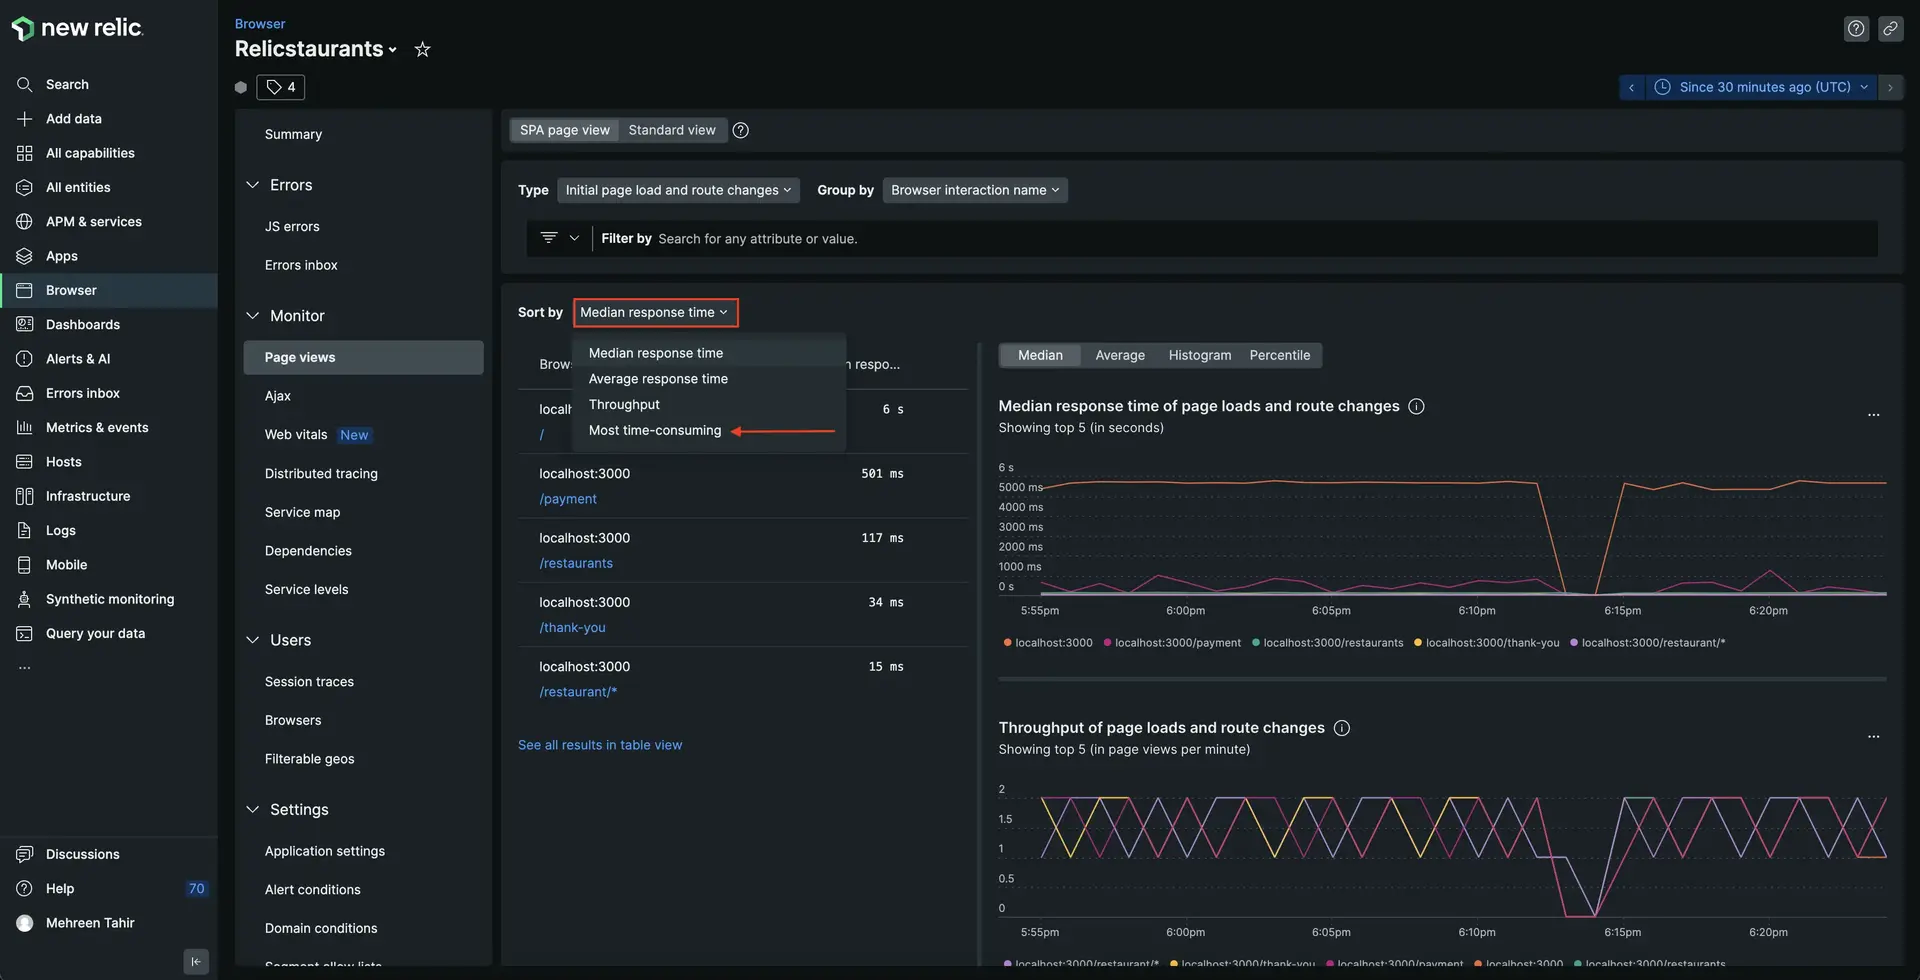
Notice that the initial page is taking almost 90% of time to load.
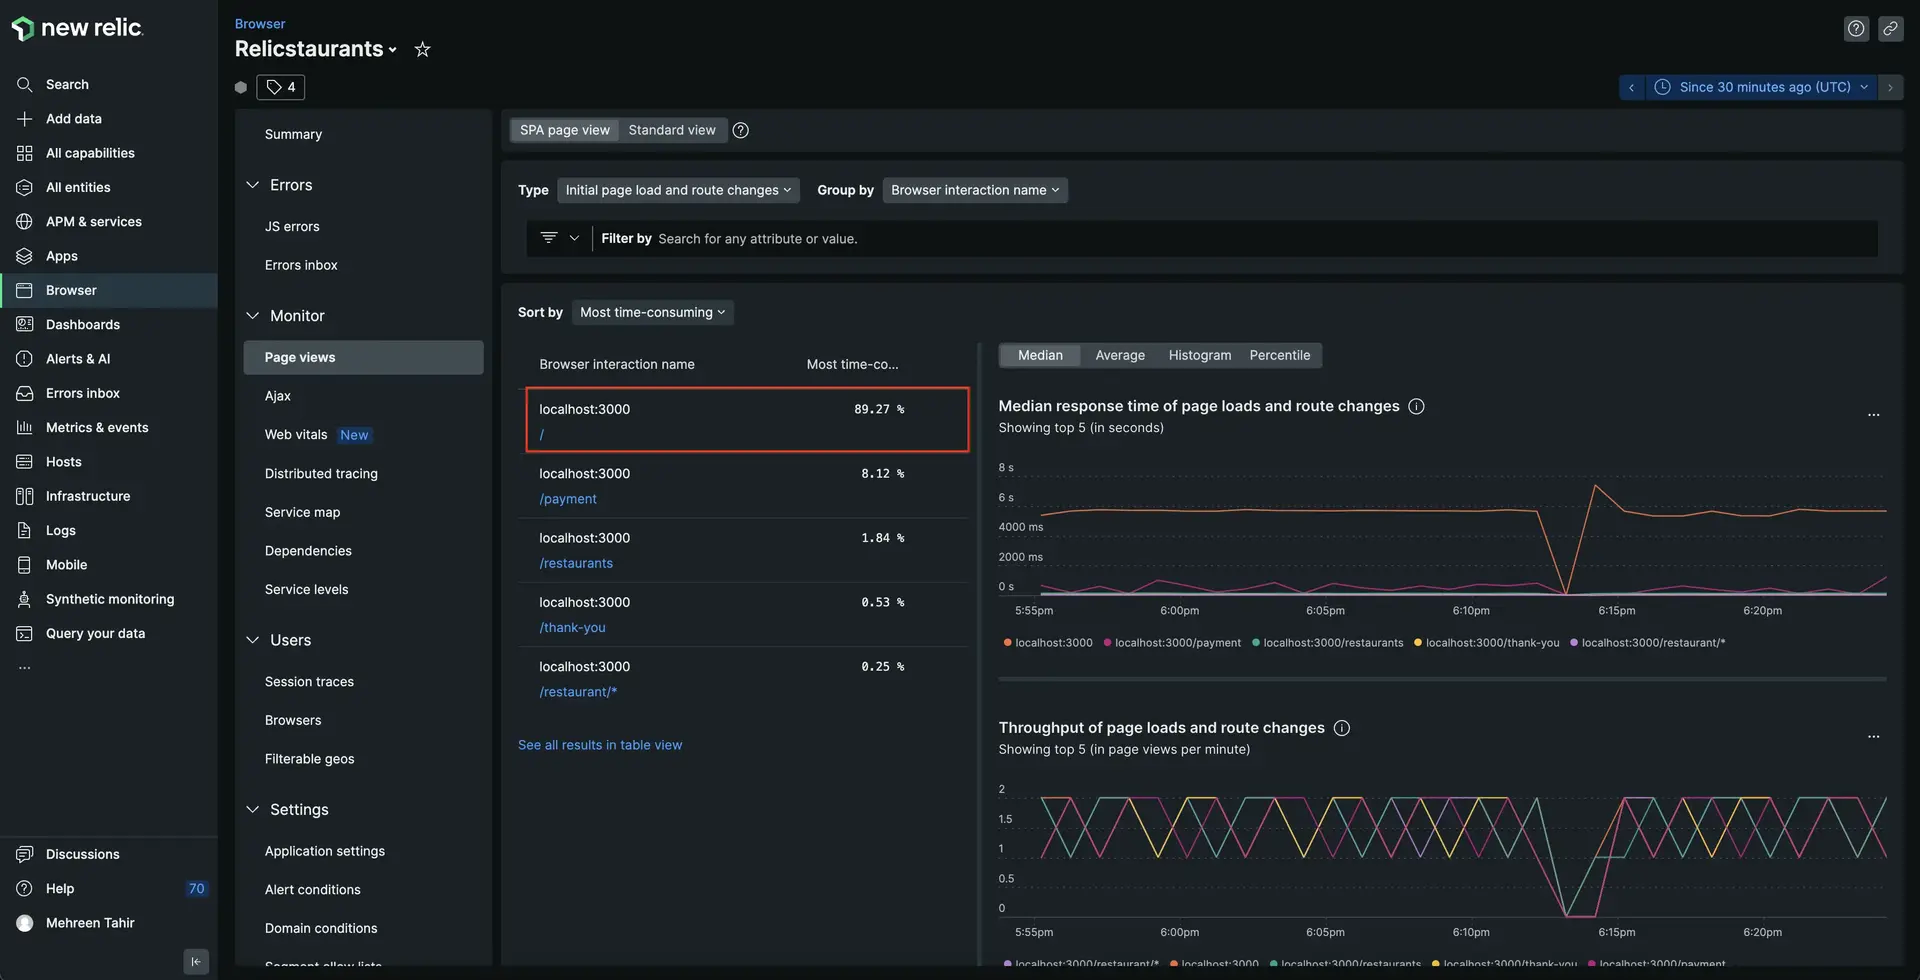
Click on it to view it's details.
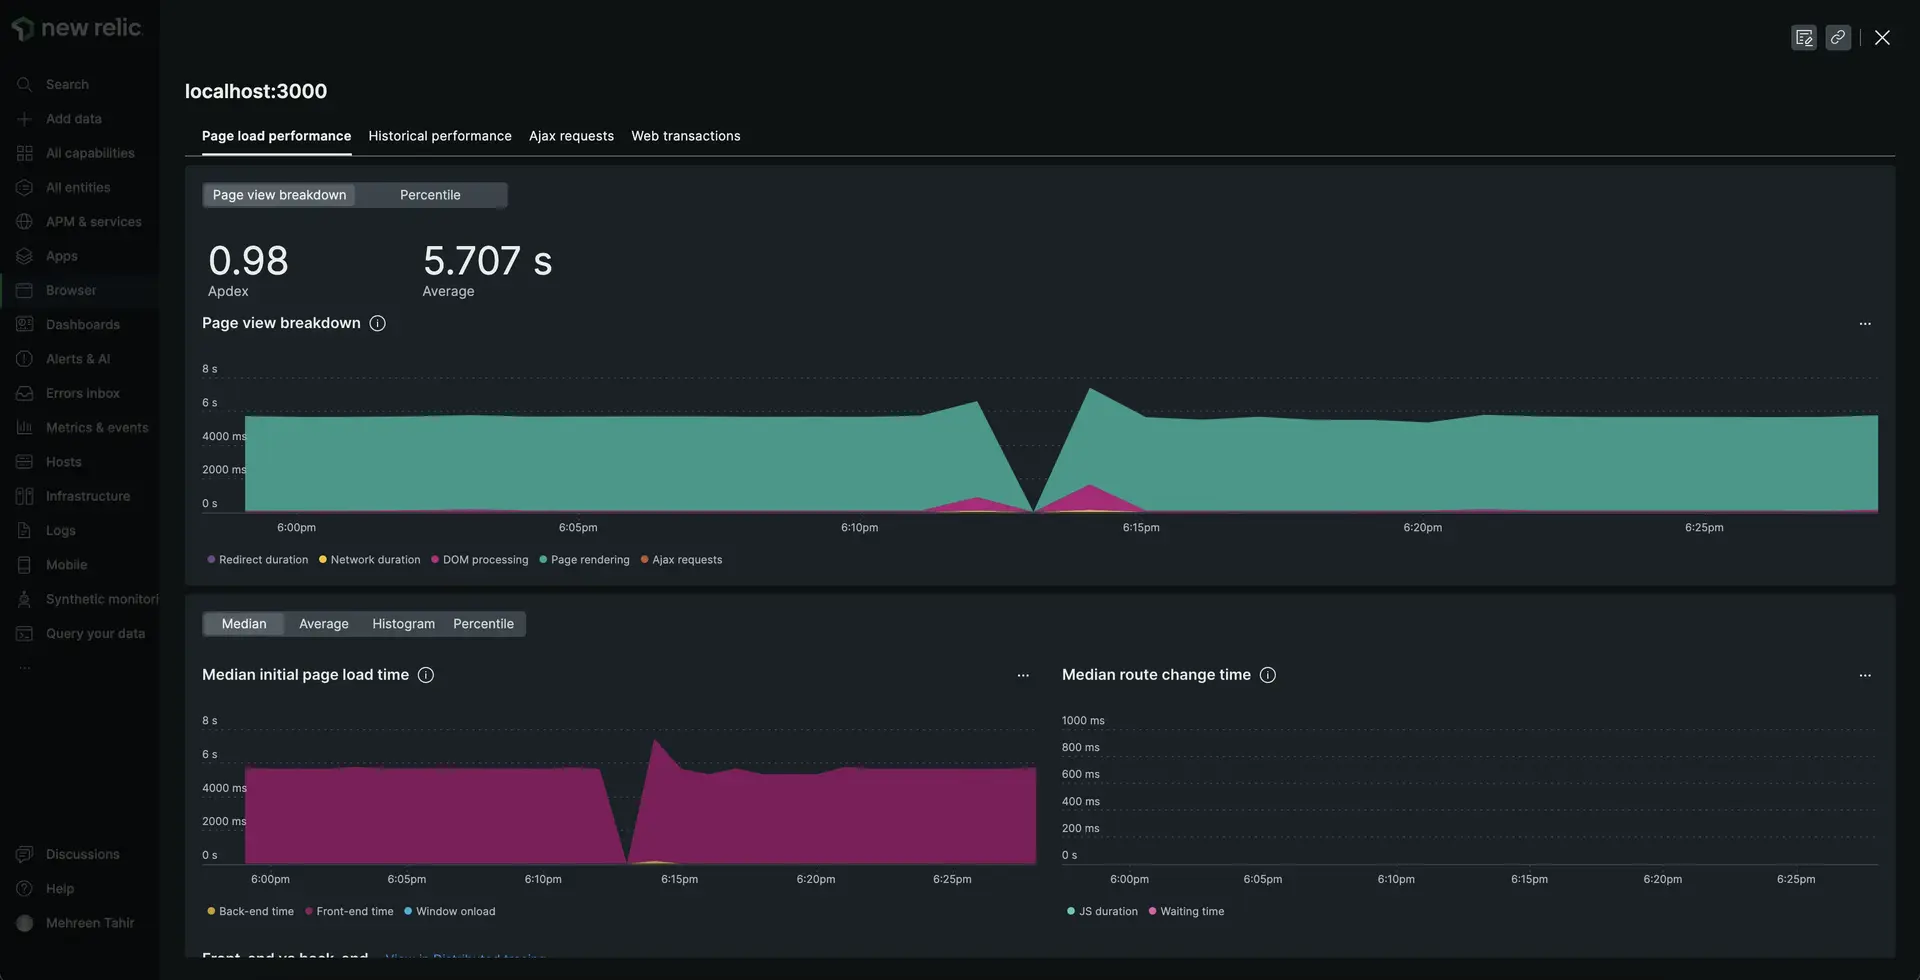
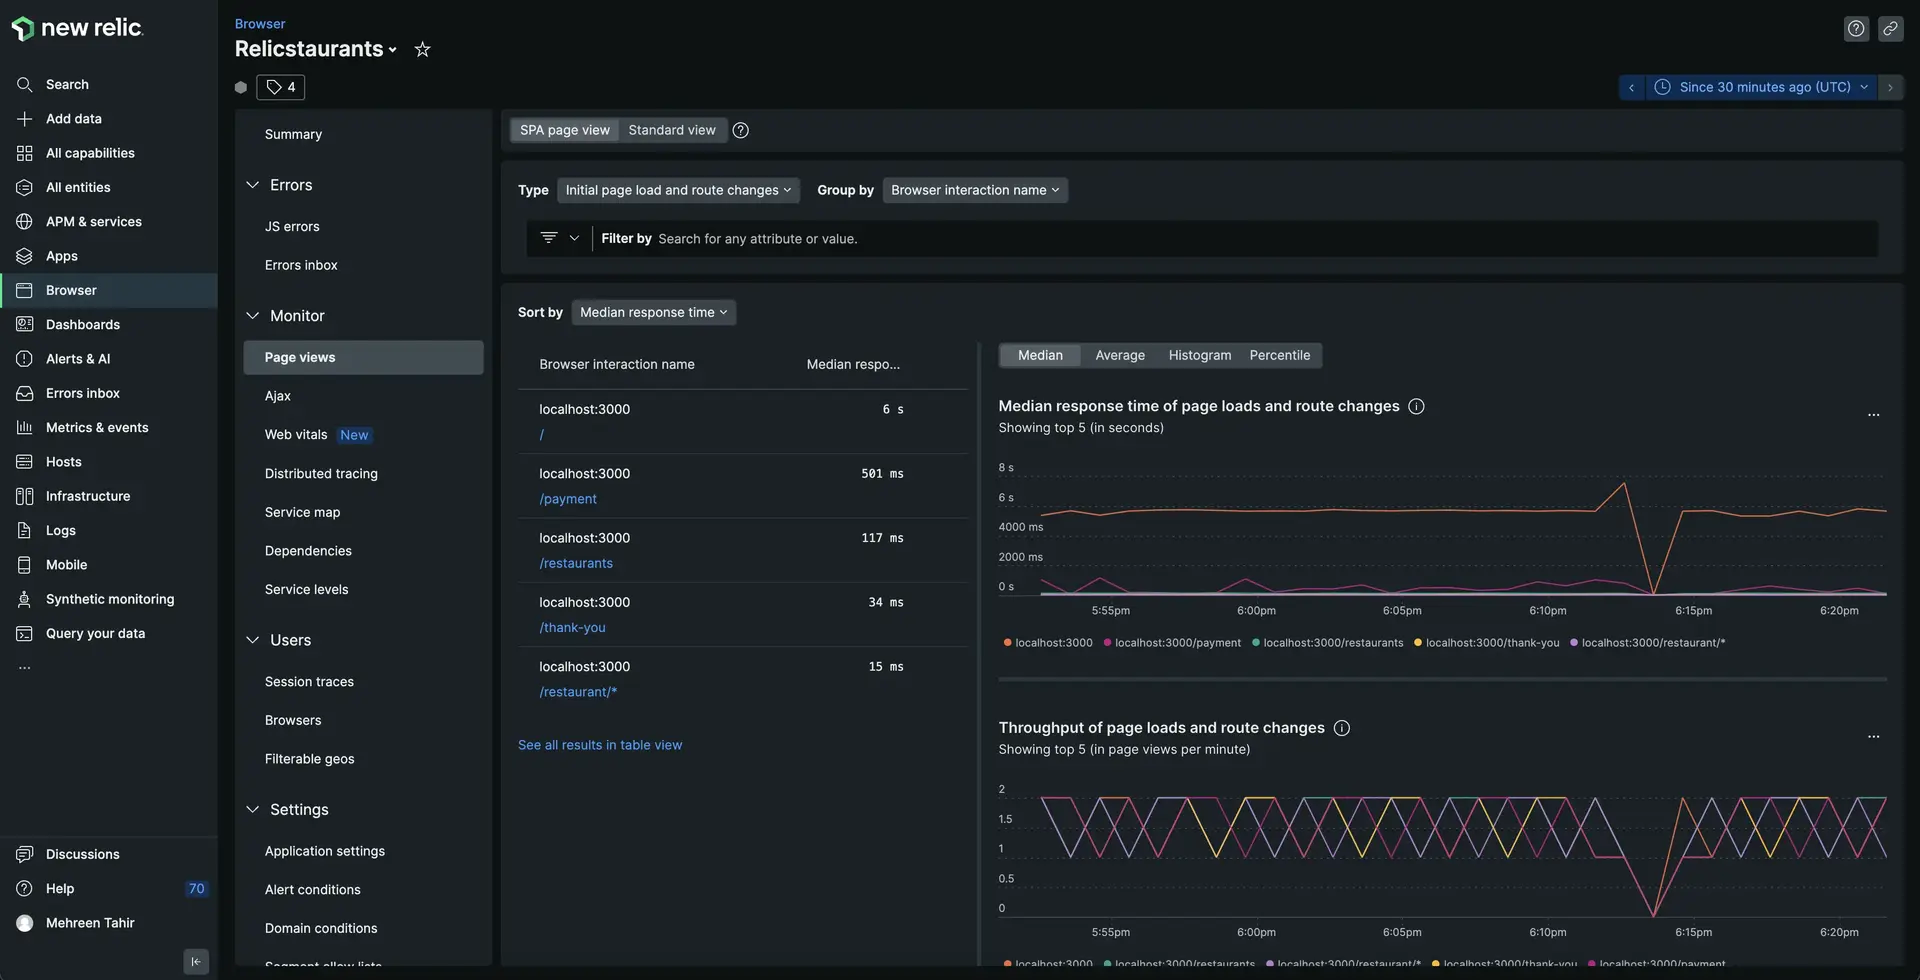
This page shows you Page view breakdown, Median initial page load time, and other important details. Page view breakdown graph is especially important here since it helps you narrow down why and where your page is taking longer. Upon taking a closer look into this graph, you see that Page rendering is taking as long as 5000 miliseconds.
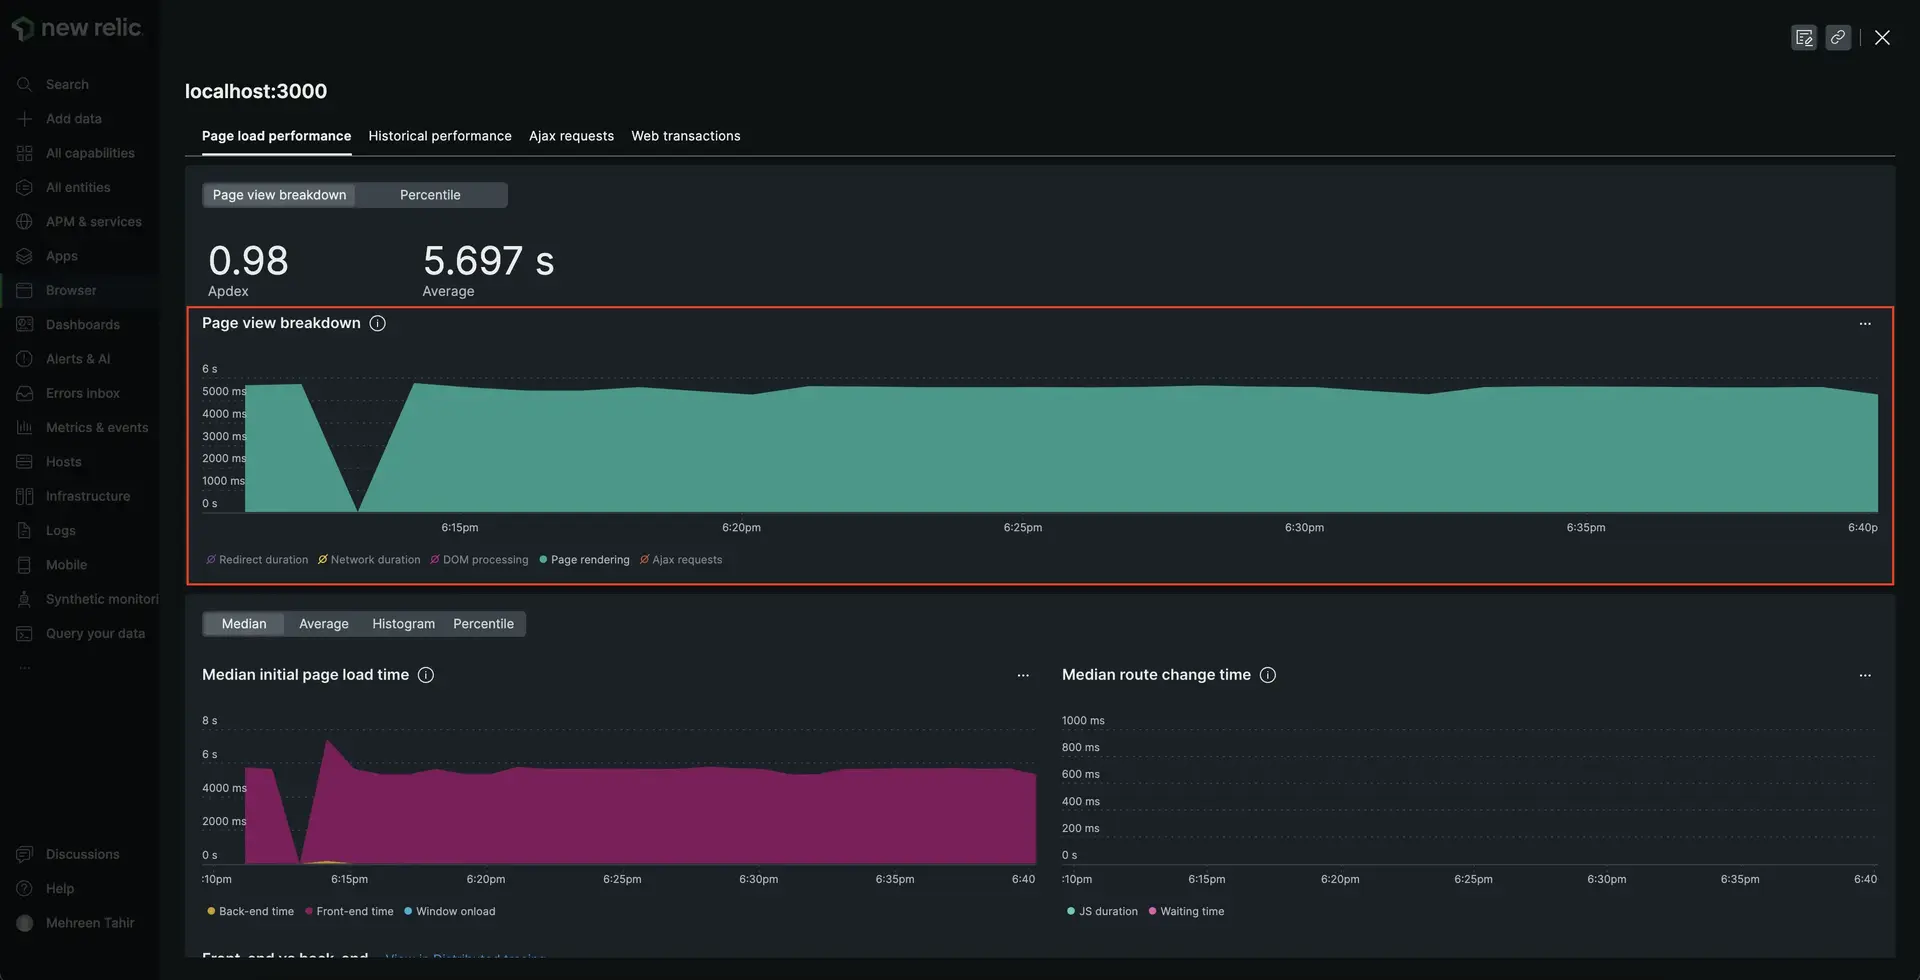
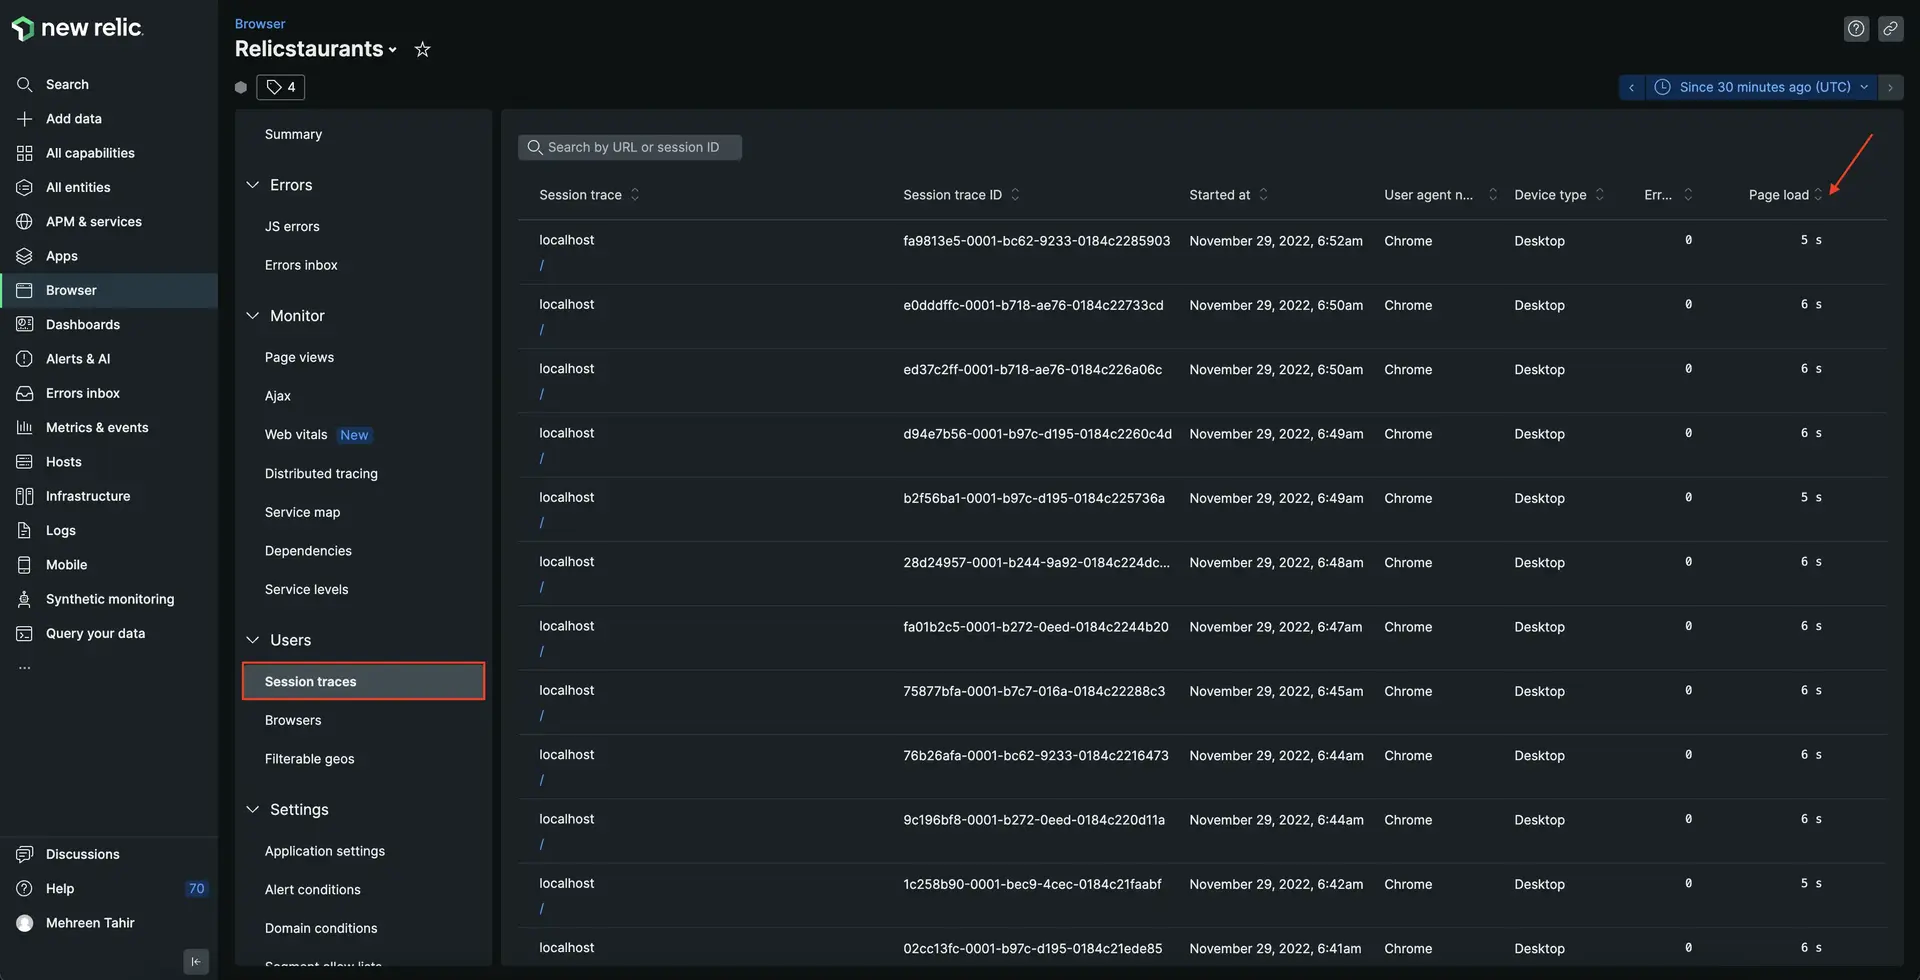
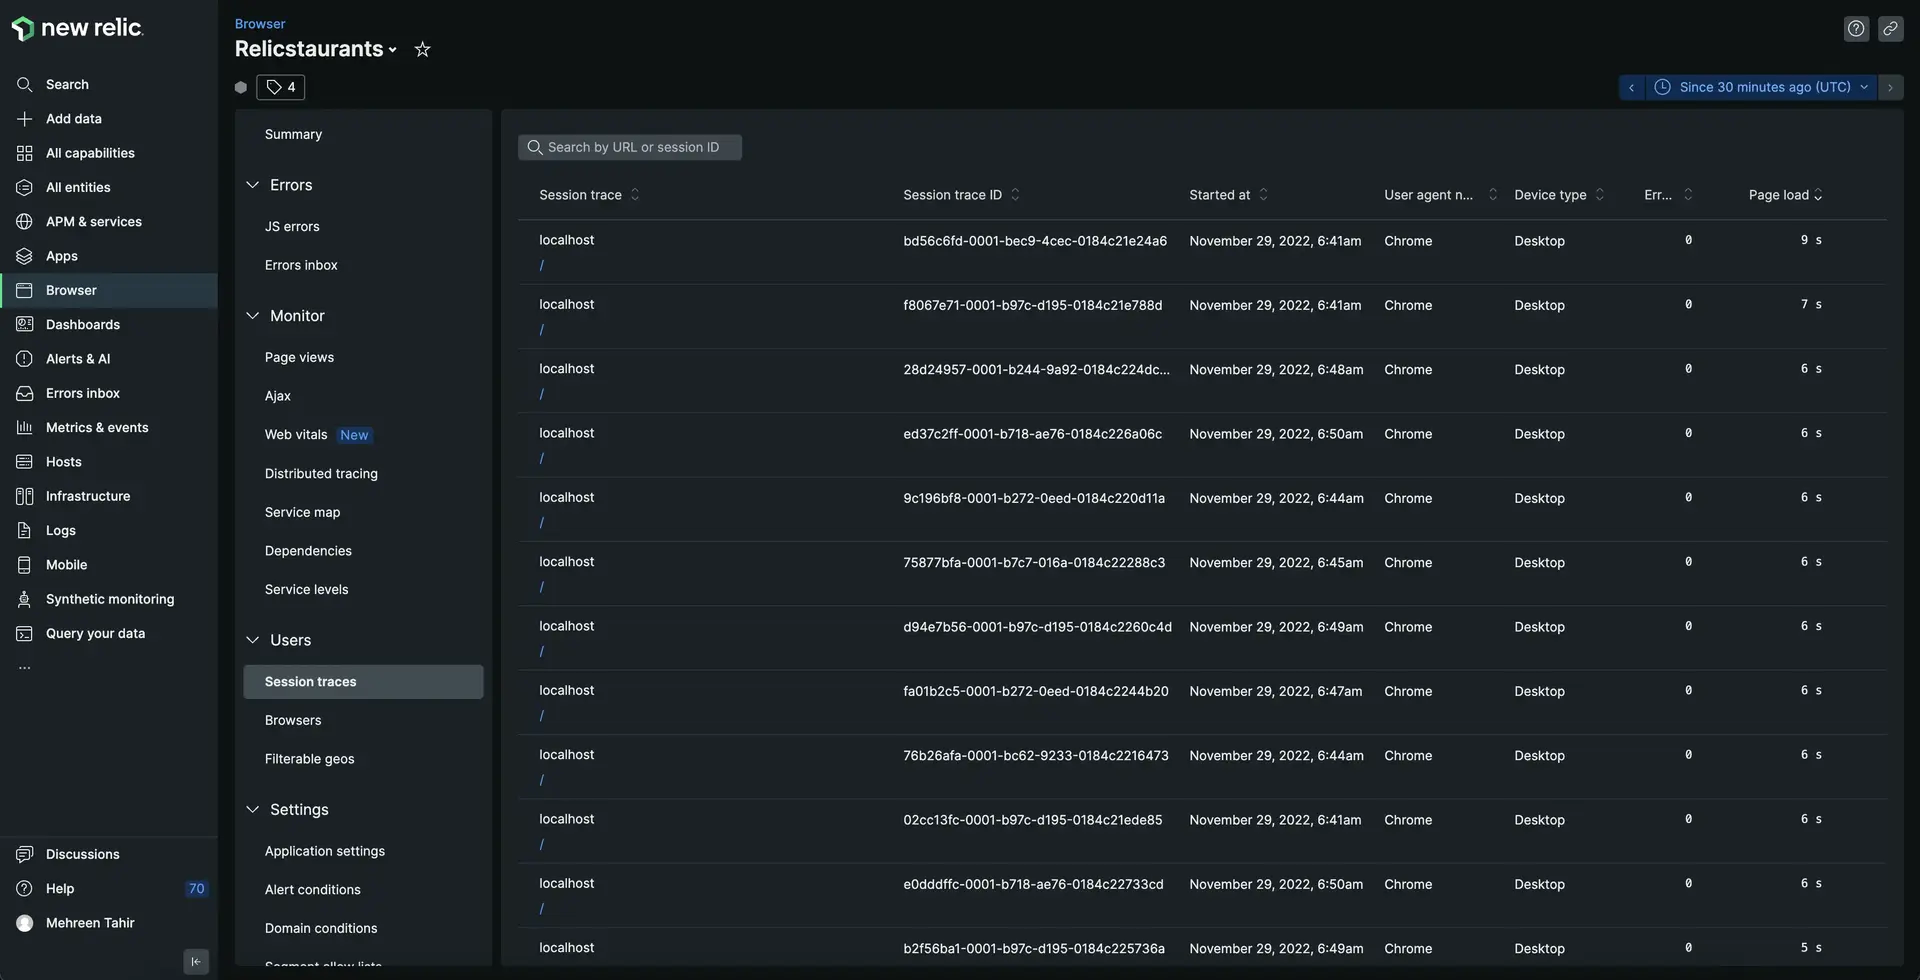
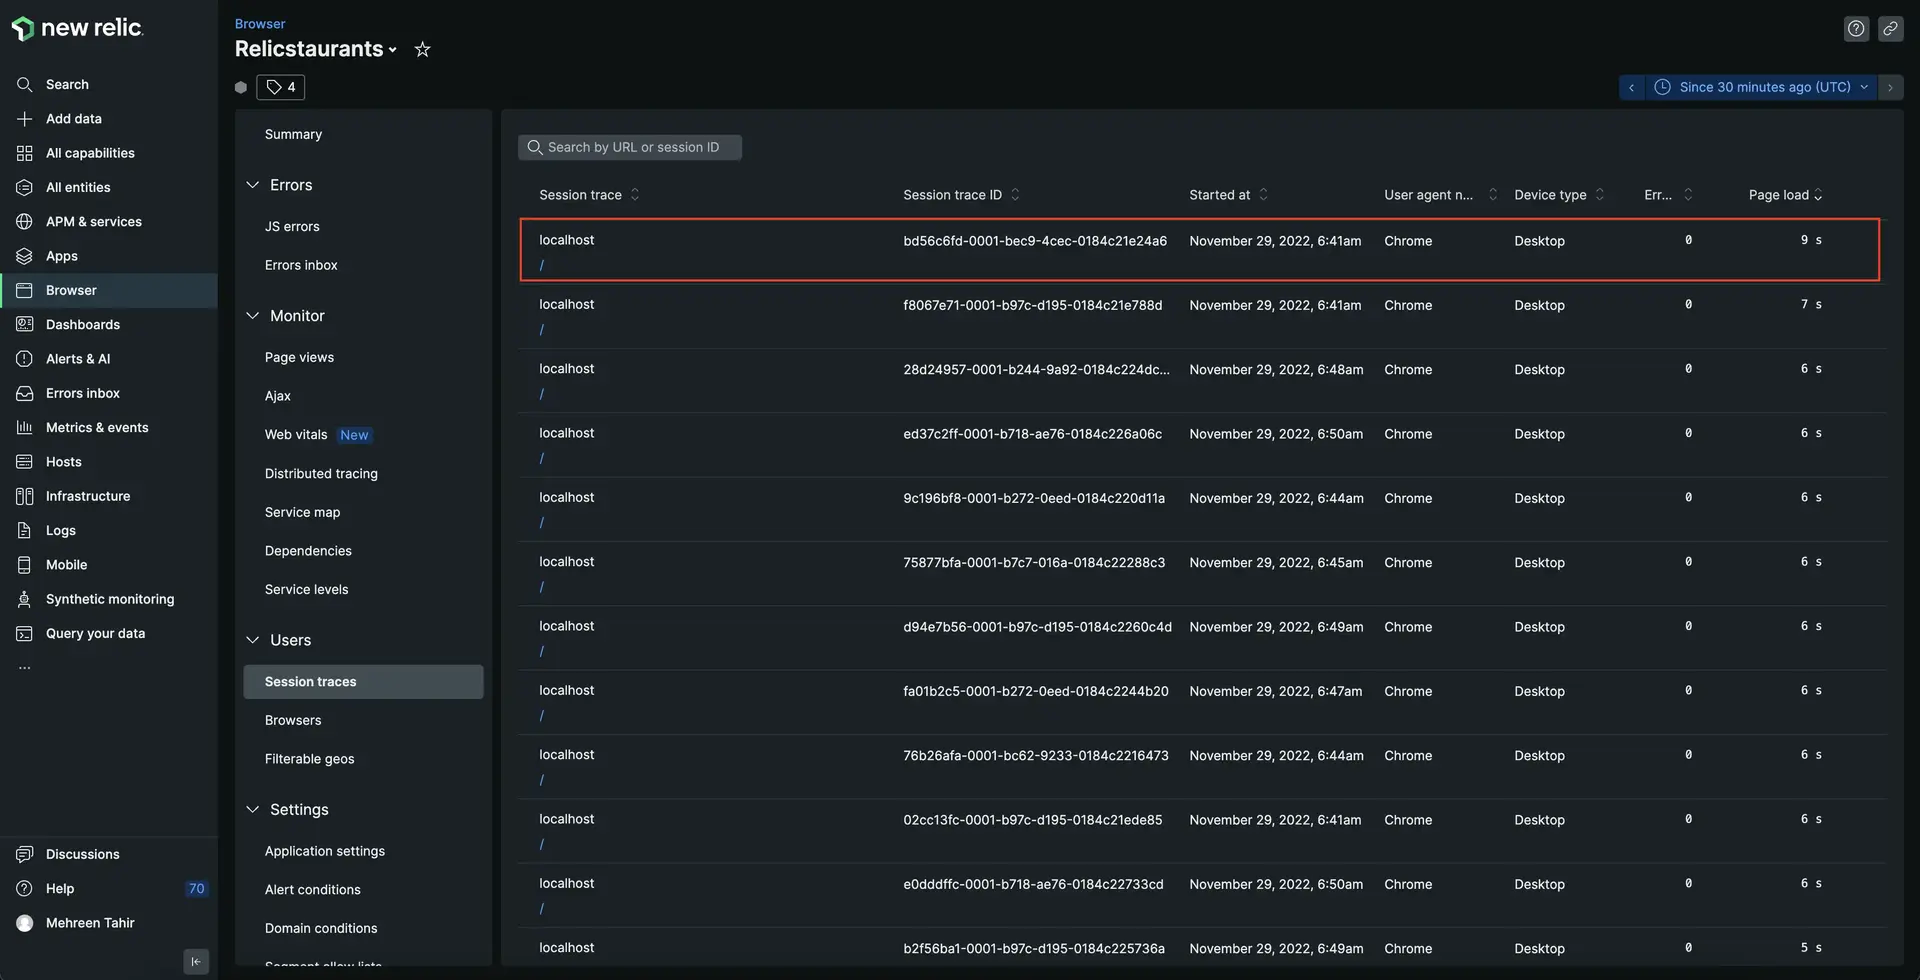
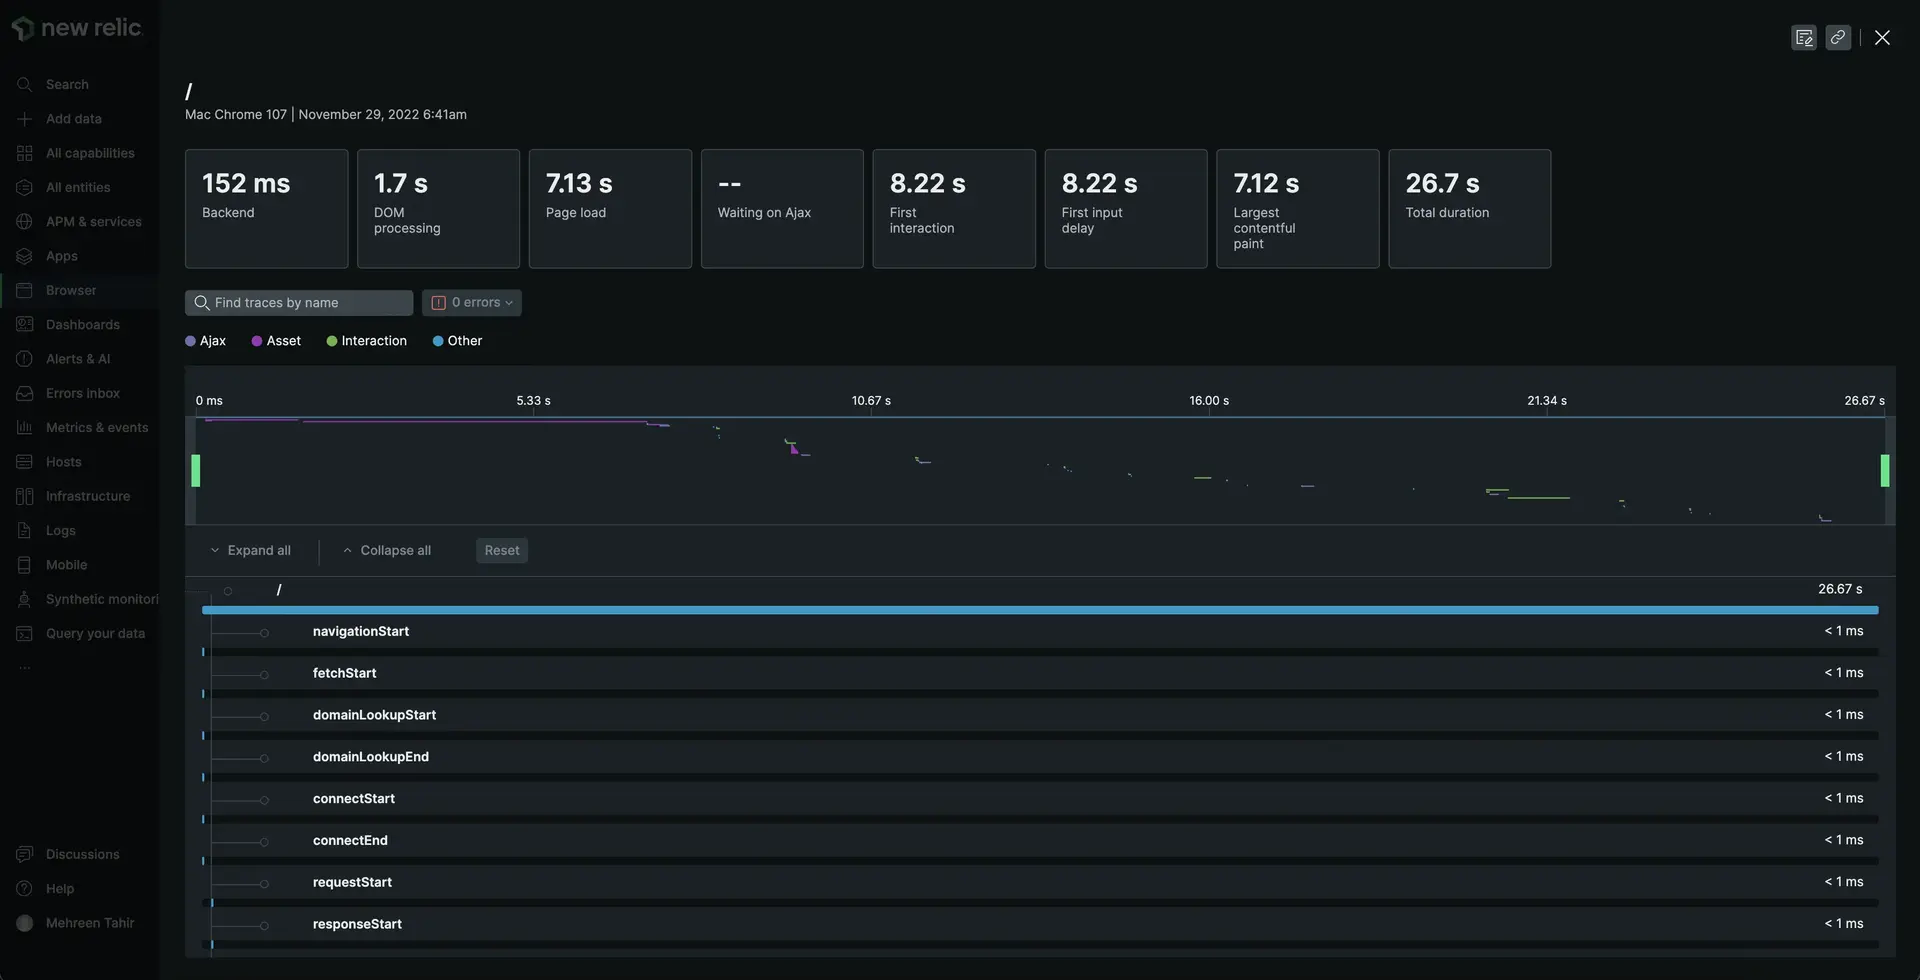
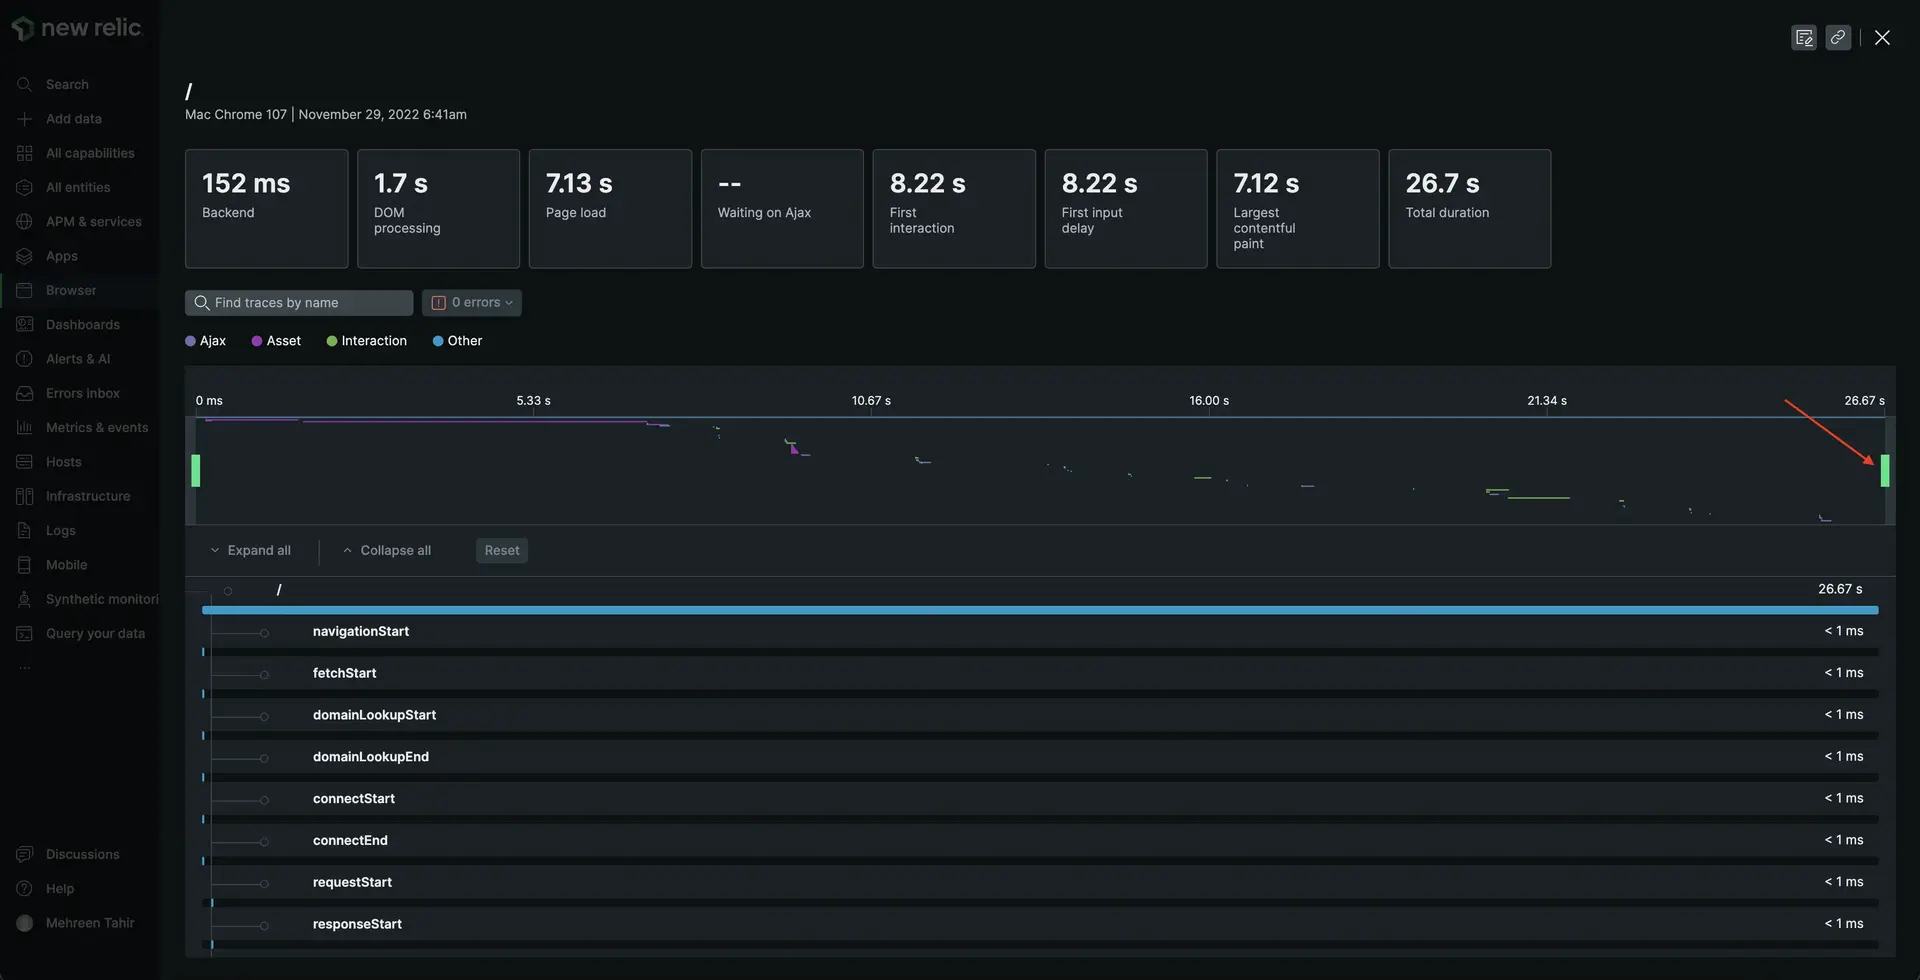
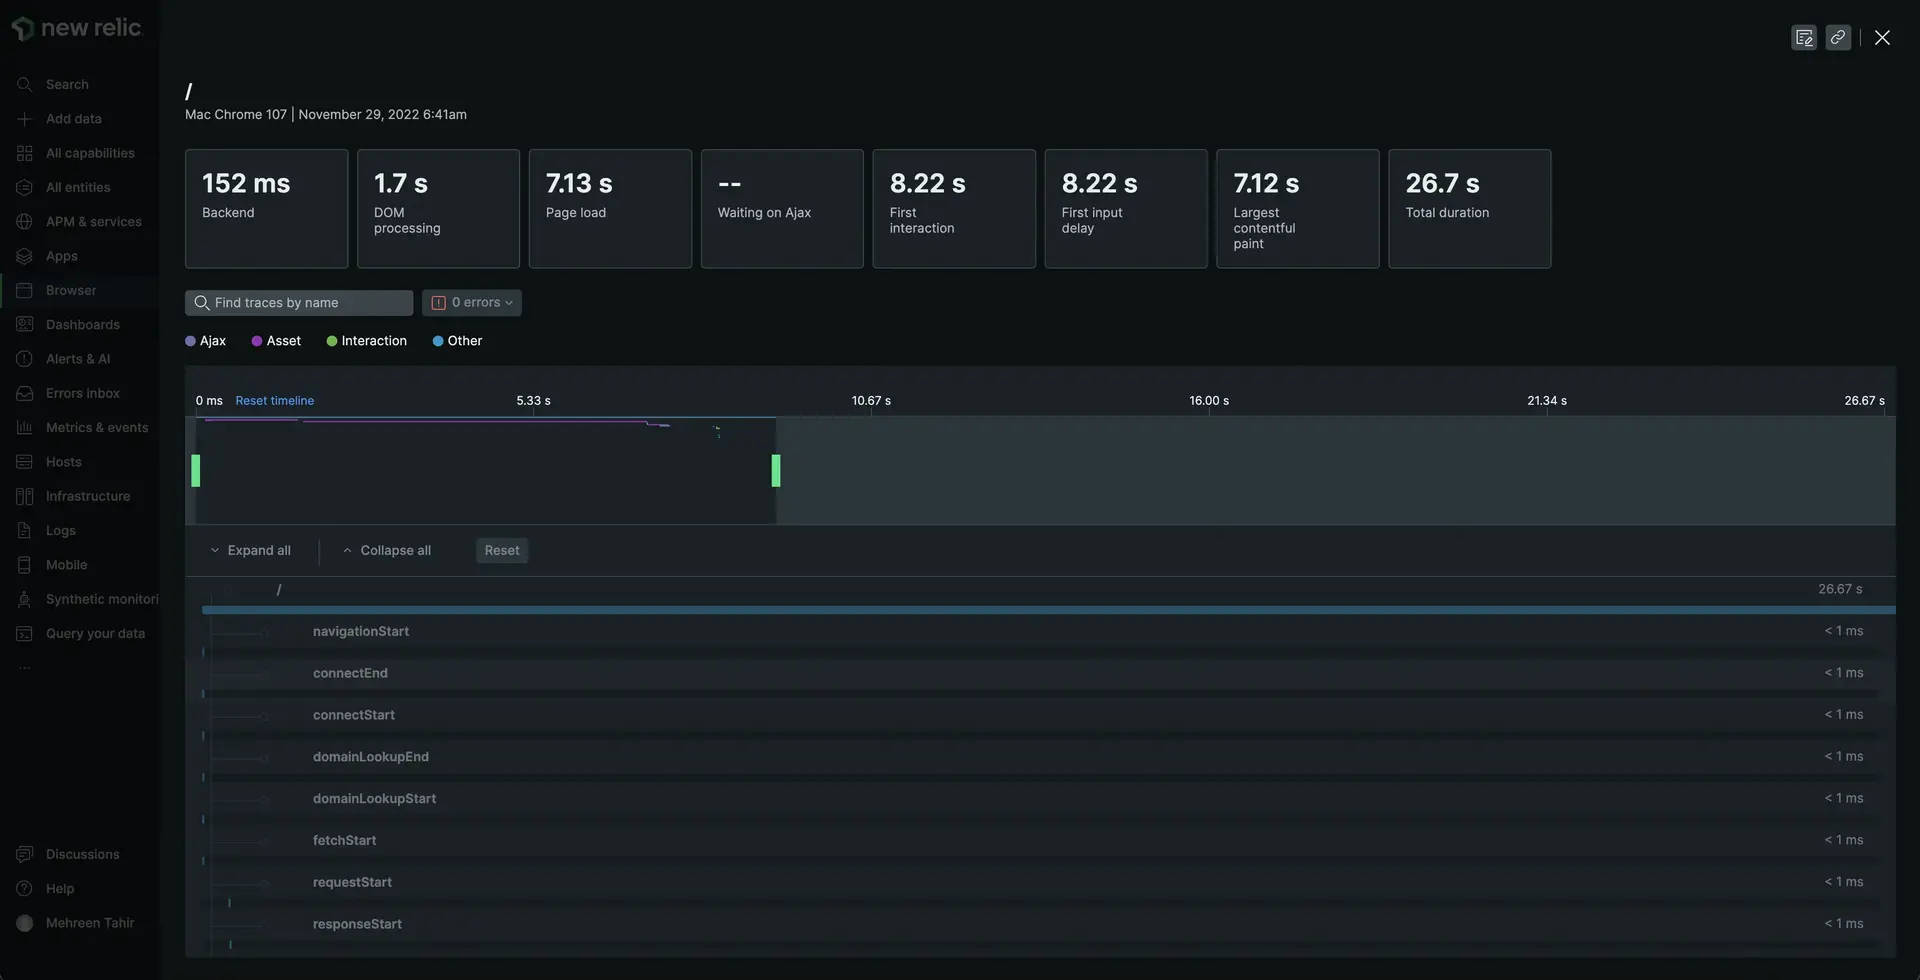
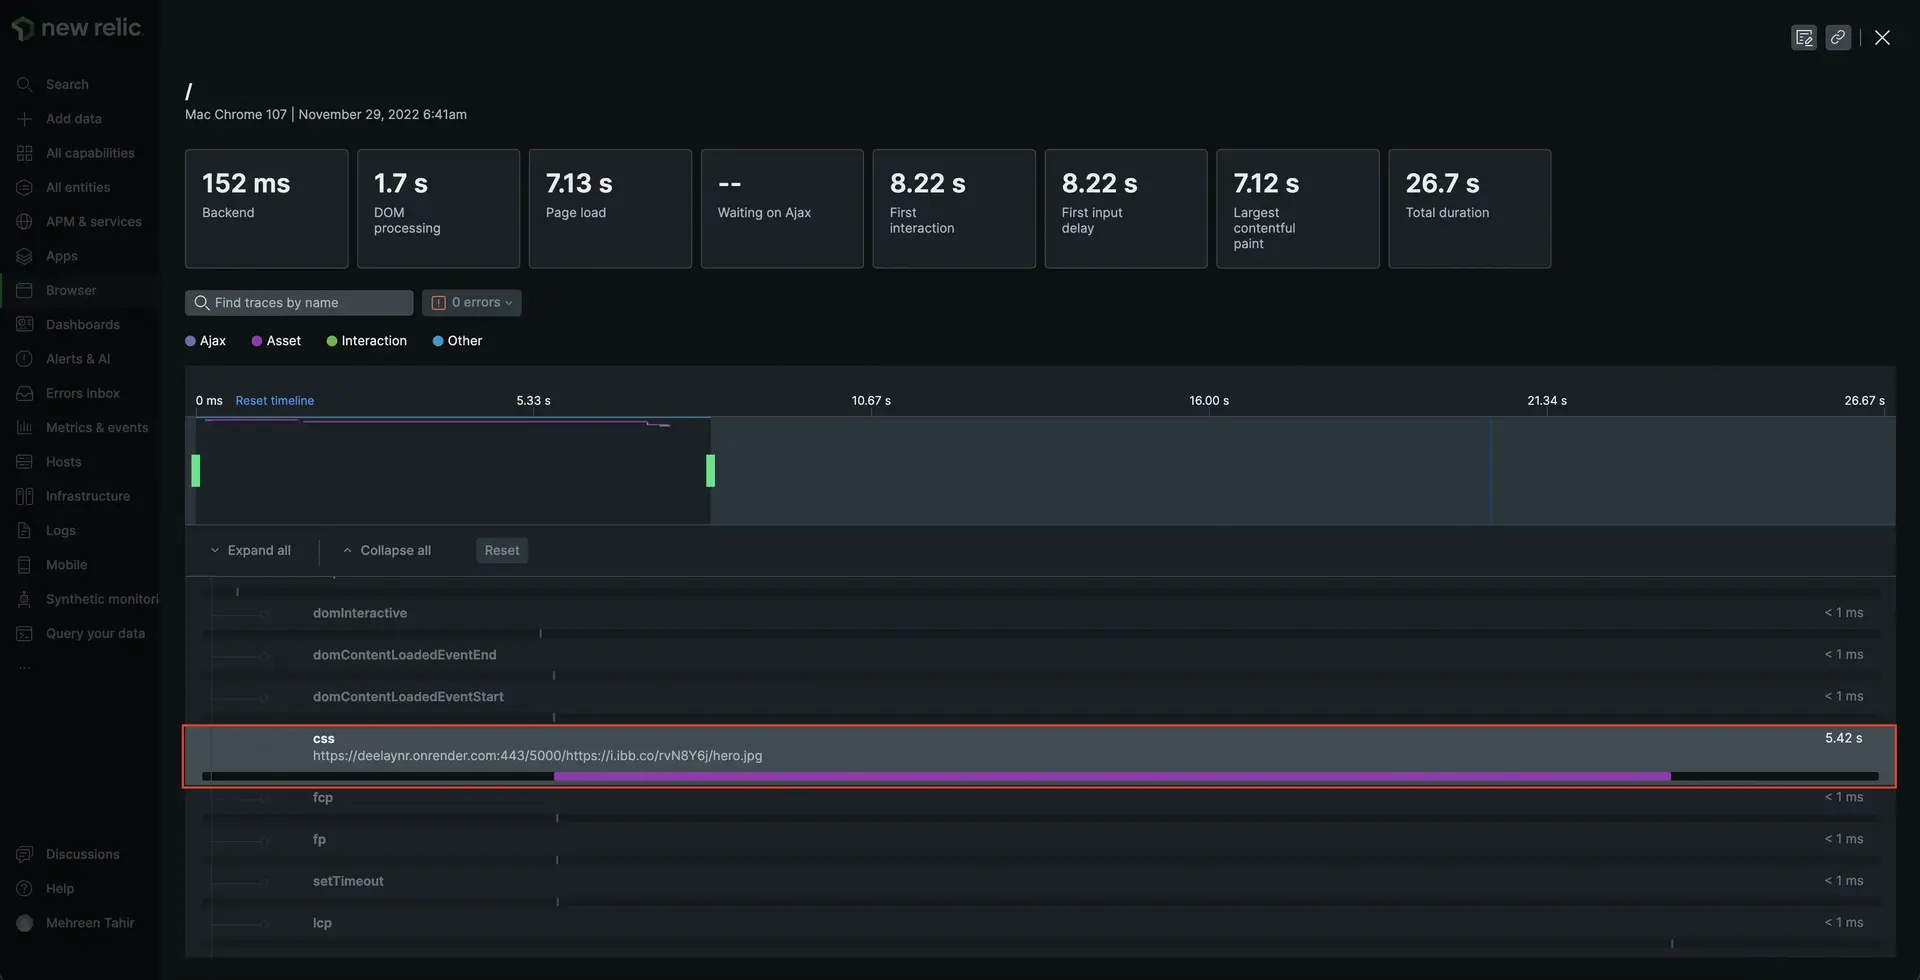
You now know that initial page is taking quite long to render making your application slow. Next, we observe the Session traces to figure out what is slowing down the rendering process.
Exit this view by clicking the X in the top right hand corner.
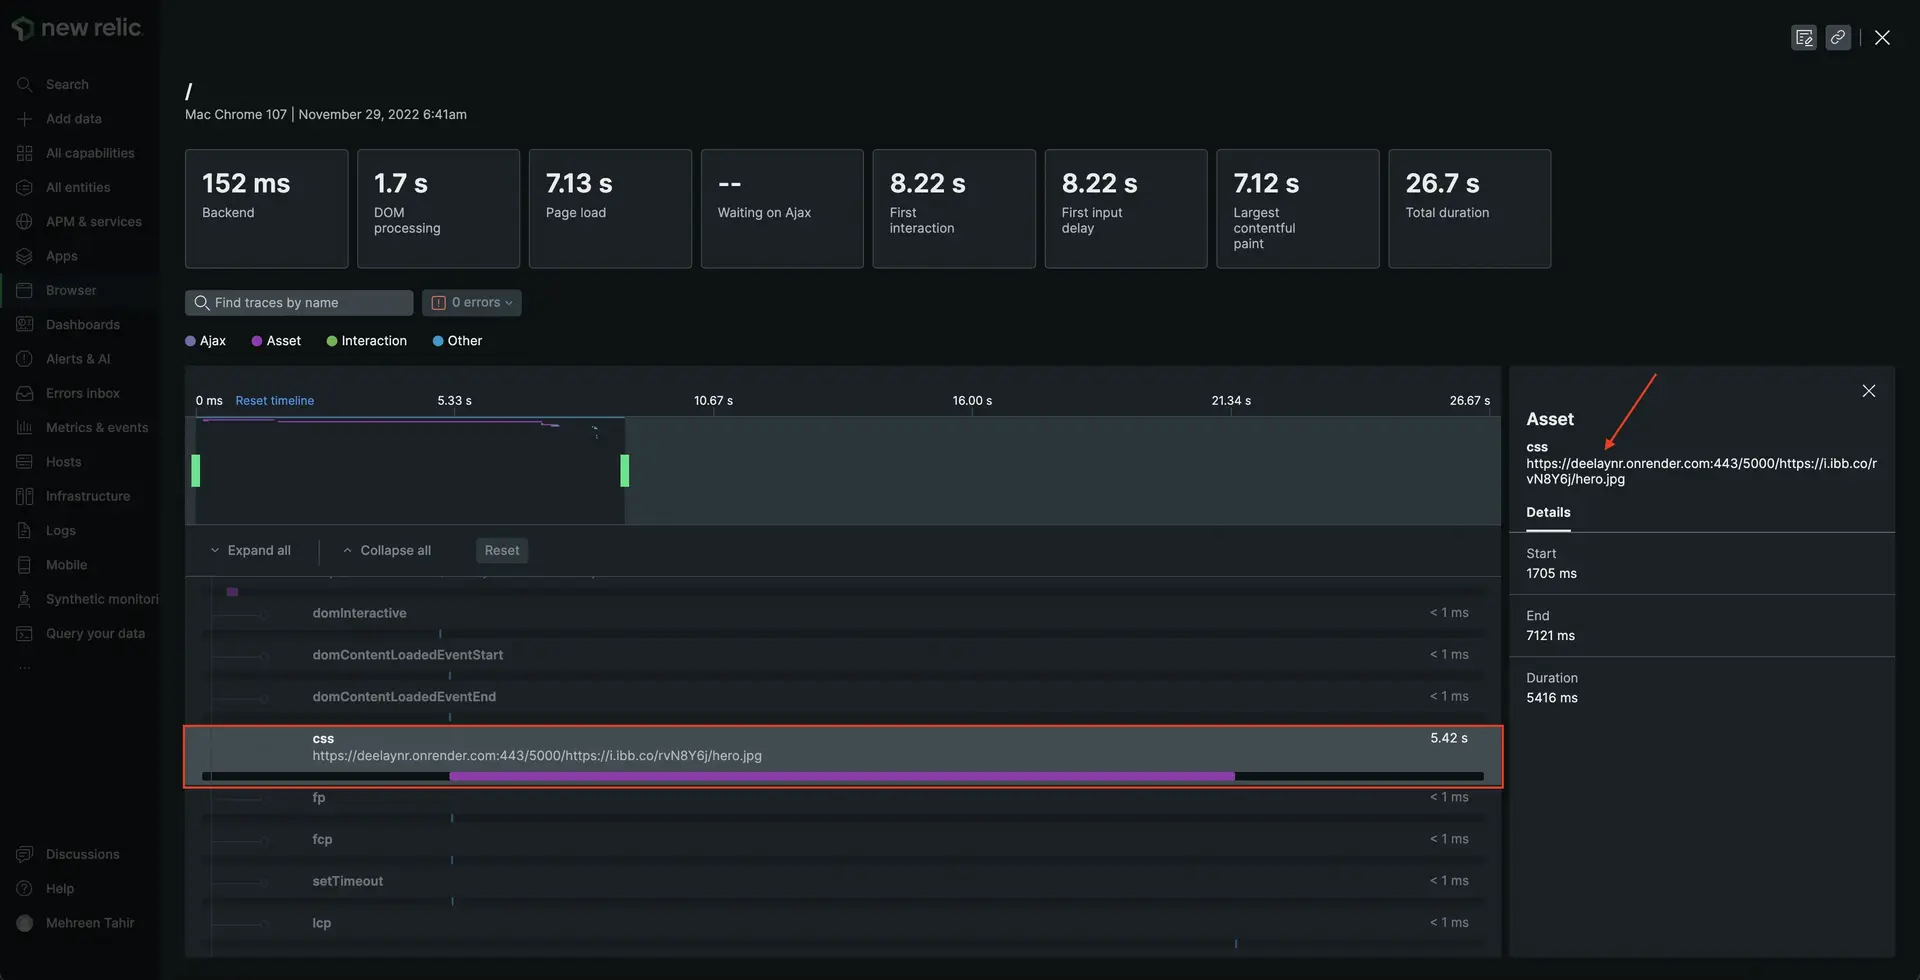
Based on these findings, you hypothesize that the background image is the culprit here. High-resolution, unoptimized images are the most common reason behind the website slowness. Good news! now that you know the reason, you can fix the problem.
Summary
To recap, you observed slowness in your application and used New Relic browser monitoring to:
- Observe Core web vitals of your site
- Narrow down the sources of slowness
Homework
Well done! Now that you've gotten a jump start with our monitoring, here are some docs that will help you take the next steps on your journey.
