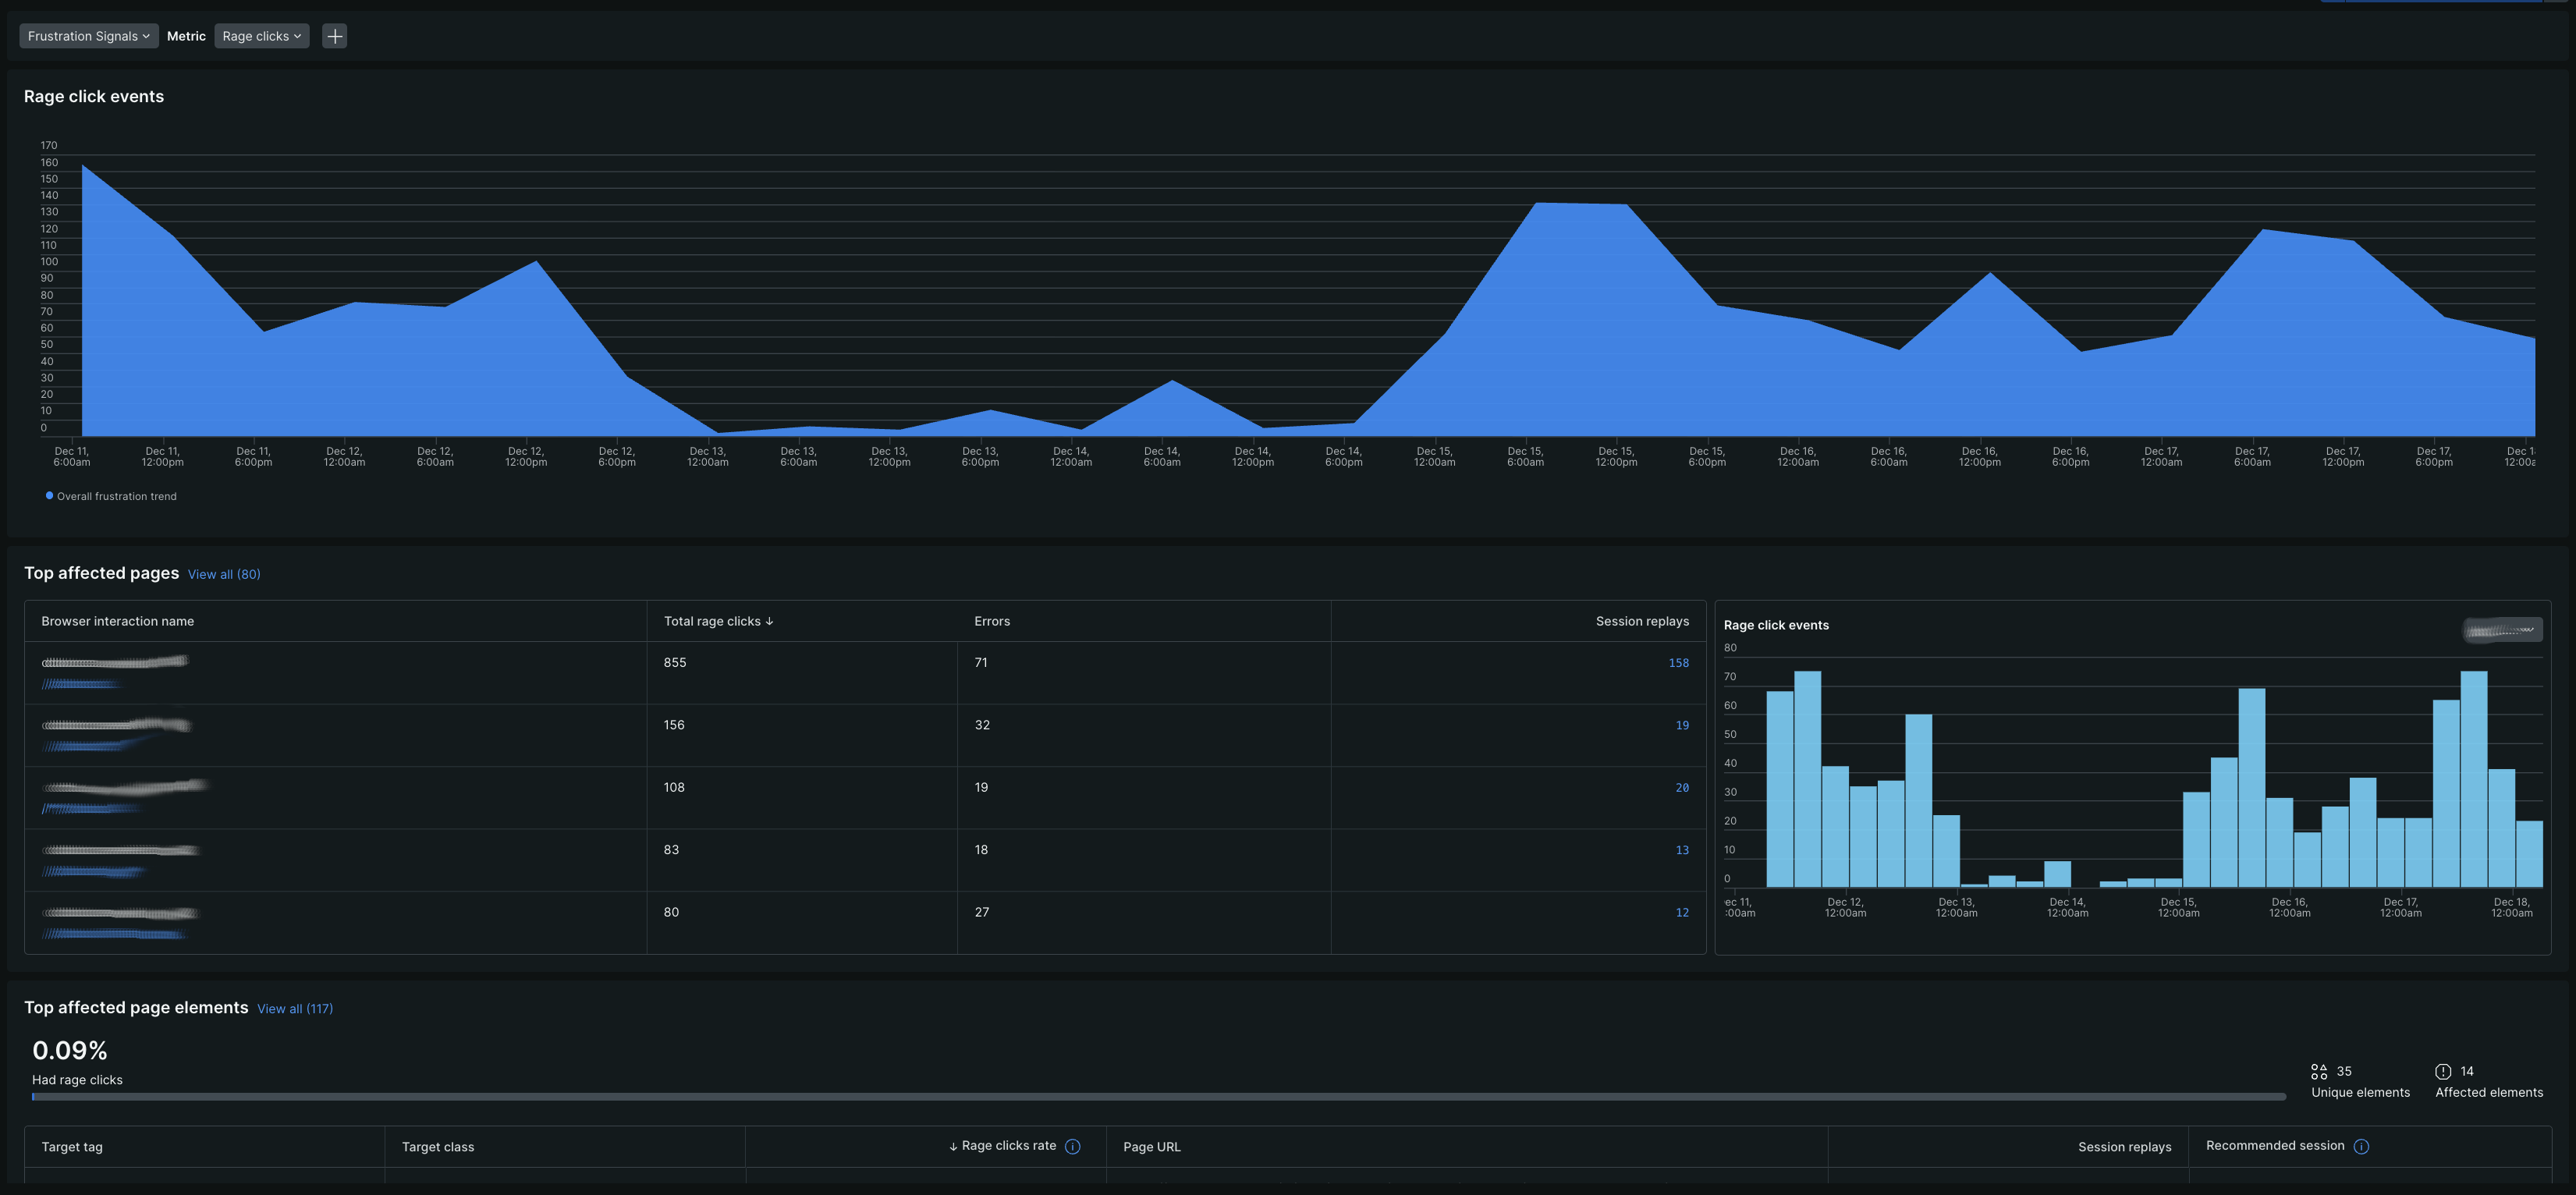
The User impact page in helps you understand how technical performance issues affect your users' actual experience. This page bridges quantitative performance metrics with qualitative user behavior analysis, providing insights into user frustration patterns and their correlation with technical problems.
The User impact page consists of two main analysis areas:
Frustration metrics
Performance risk
Each provides different lenses for understanding user experience issues and their technical root causes.
Prerequisite:
- Browser agent version 1.269 or later is required to capture frustration signals and performance risk data.
- Session Replay must be enabled to access session replays linked from this page.
Access User impact analysis
To view the User impact page:
- Go to one.newrelic.com > All capabilities > Browser > (select an app) > Users > User impact.
- Select either Frustration metrics or Performance risk from the tab.
Tip
You can also navigate here directly from the Page views page by clicking Analyze frustration signals or Analyze performance risk link.

Analyze frustration metrics
The Frustration metrics tab focuses on user behavioral indicators that signal confusion, annoyance, or difficulty completing tasks. This analysis helps you identify where users struggle most and prioritize fixes based on actual user pain points.
The Frustration metrics tab includes the following sections:
- Rage click: Identifies pages and elements where users exhibit rapid, repeated clicking behavior, indicating frustration with unresponsive or broken UI components.
- Top affected pages: Highlights the specific pages generating the most frustration signals, allowing you to focus on high-impact areas.
- Top affected page elements: Provides granular insights into which specific UI elements are causing the most user frustration.
Analyze performance metric
The Performance risk tab examines how technical performance problems affect user sessions, focusing on measurable performance metrics and their correlation with user experience issues.
The Performance risk tab includes the following sections:
- Web vitals: Analyzes how poor core web vitals (LCP, INP, CLS) impact user sessions and experience.
- Error analysis: Investigates JavaScript error patterns and their effect on user sessions.
- Top affected pages: Identifies which pages experience the most performance-related user impact.
- Geography analysis: Examines performance risk across different geographic locations to identify regional issues.