Aporia is a fast, easy, and secure way for data science teams to monitor their machine learning models in production. With Aporia, teams can build their own customizable monitors in minutes to receive live alerts for early detection of issues like data drift, unexpected bias, data integrity issues, and performance degradation. Aporia also has an investigation toolbox to enable further investigation and root cause analysis. Learn more about Aporia.
Aporia includes an integration with New Relic to provide full model management of your MLOps infrastructure, with customized within New Relic that show inferences investigation.
Integrate Aporia with New Relic
Aporia allows you to connect generated by Aporia's monitors to New Relic's incident intelligence engine and the predictions data in order to create a comprehensive monitoring dashboard in New Relic for your models.
- Login into Aporia's console: On the navbar on the left, click on Integrations and choose New Relic.
- Login into your New Relic account: Go to one.newrelic.com > All capabilities > +Add more data.
- Click on Aporia: In the search bar, type Aporia.
- Select your account ID: Select the account ID you want Aporia to integrate with.
- Get a New Relic API key: Once you click on the Aporia icon, follow step one. Under Prediction data & model quality alerts, click either Select, to choose an existing key, or Create API key. This created a New Relic , which is used for reporting data to New Relic.
- Paste the key in Aporia: Now go to Aporia's dashboard and under the New Relic Integration screen, paste the key under New Relic insert token. Once pasted, click Save.
- Verify the key: In the Aporia dashboard, click on the Verify token button to verify the key is working properly. A Green check mark or Red error marks should appear to indicate the status.
Did this doc help with your installation?
Monitor your machine learning models with Aporia
Now that you've integrated New Relic and Aporia, you can monitor your data using dashboards with automated charts created by Aporia.
Go to the integration dashboard: Once you've verified your tokens and confirmed the integration is set up correctly, return to the New Relic integration dashboard and click on See your data. This will redirect you to an automatically generated dashboard displaying data reported to Aporia in New Relic.
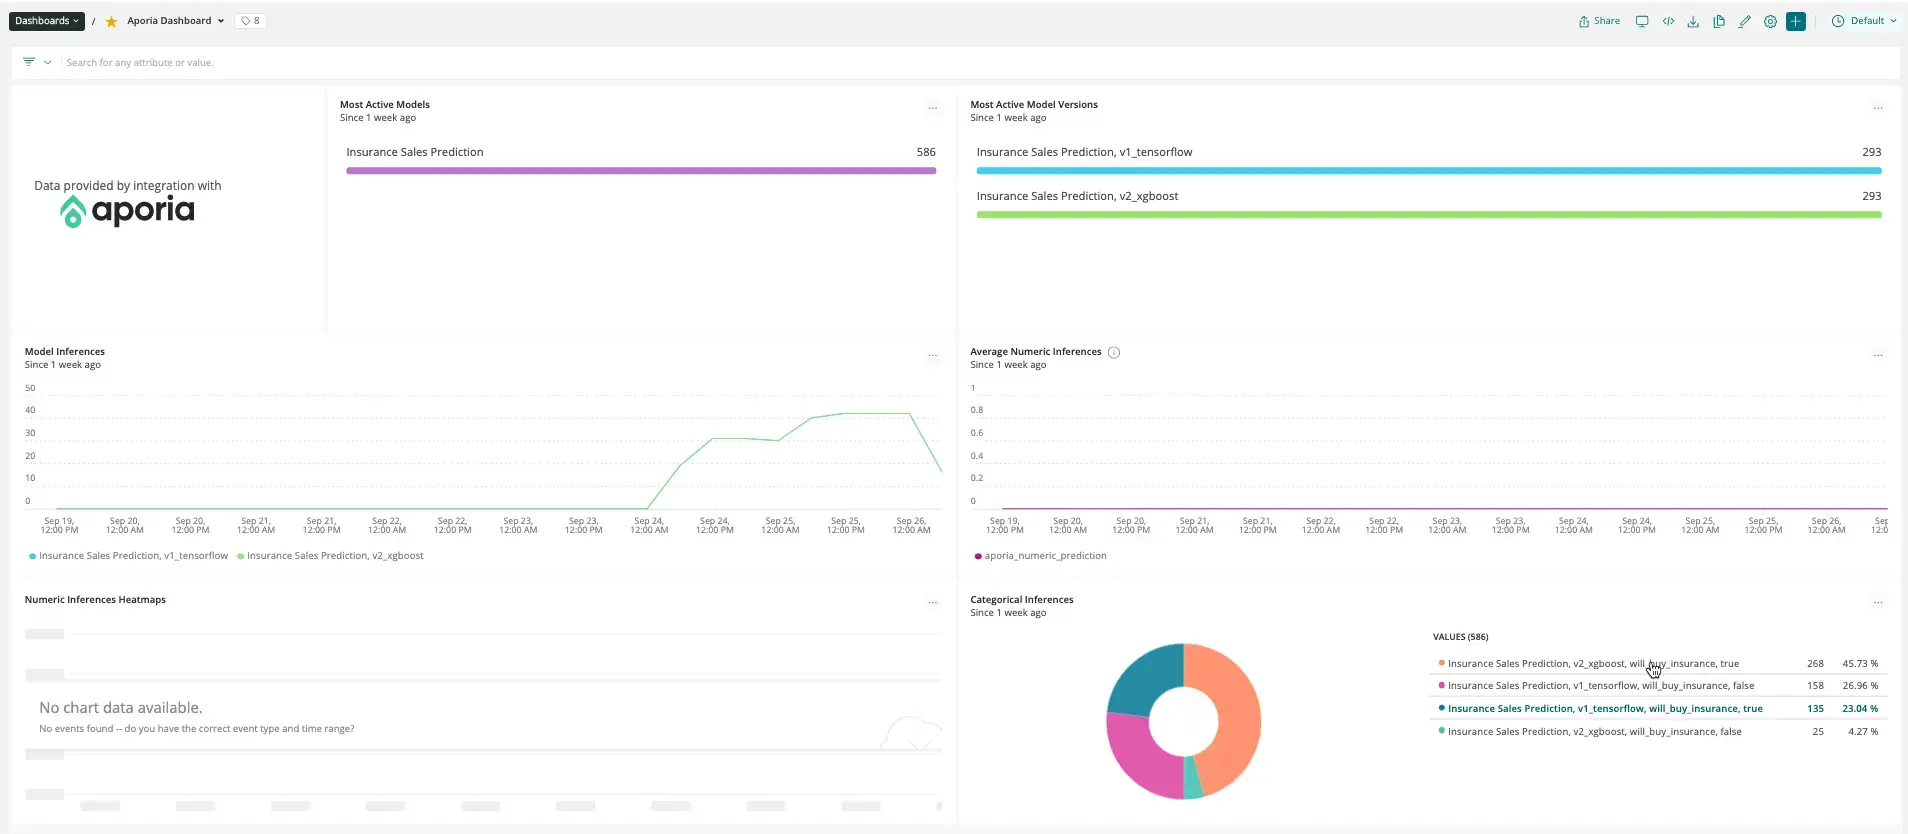
Analyze Aporia's dashboard. Aporia's dashboard populated in New Relic contains 6 charts:
- The Most active models chart displays the different models which reported predictions in the selected timeframe.
- The Most active model versions chart displays the different versions which reported predictions in the selected timeframe.
- The Model inferences graph displays the number of unique predictions reported for each model and version.
- The Average numeric inferences chart displays the average value numeric predictions reported for each model and version.
- The Numeric inferences heatmaps chart displays a histogram of the numeric predictions reported for each model and version.
- The Categorical inferences charts display the different unique values and their frequencies of categorical predictions reported for each model and version.

Filter data: Click on the … button and click on Edit. On the right navbar, under User as filter, enable Filter the current dashboard and click Save.
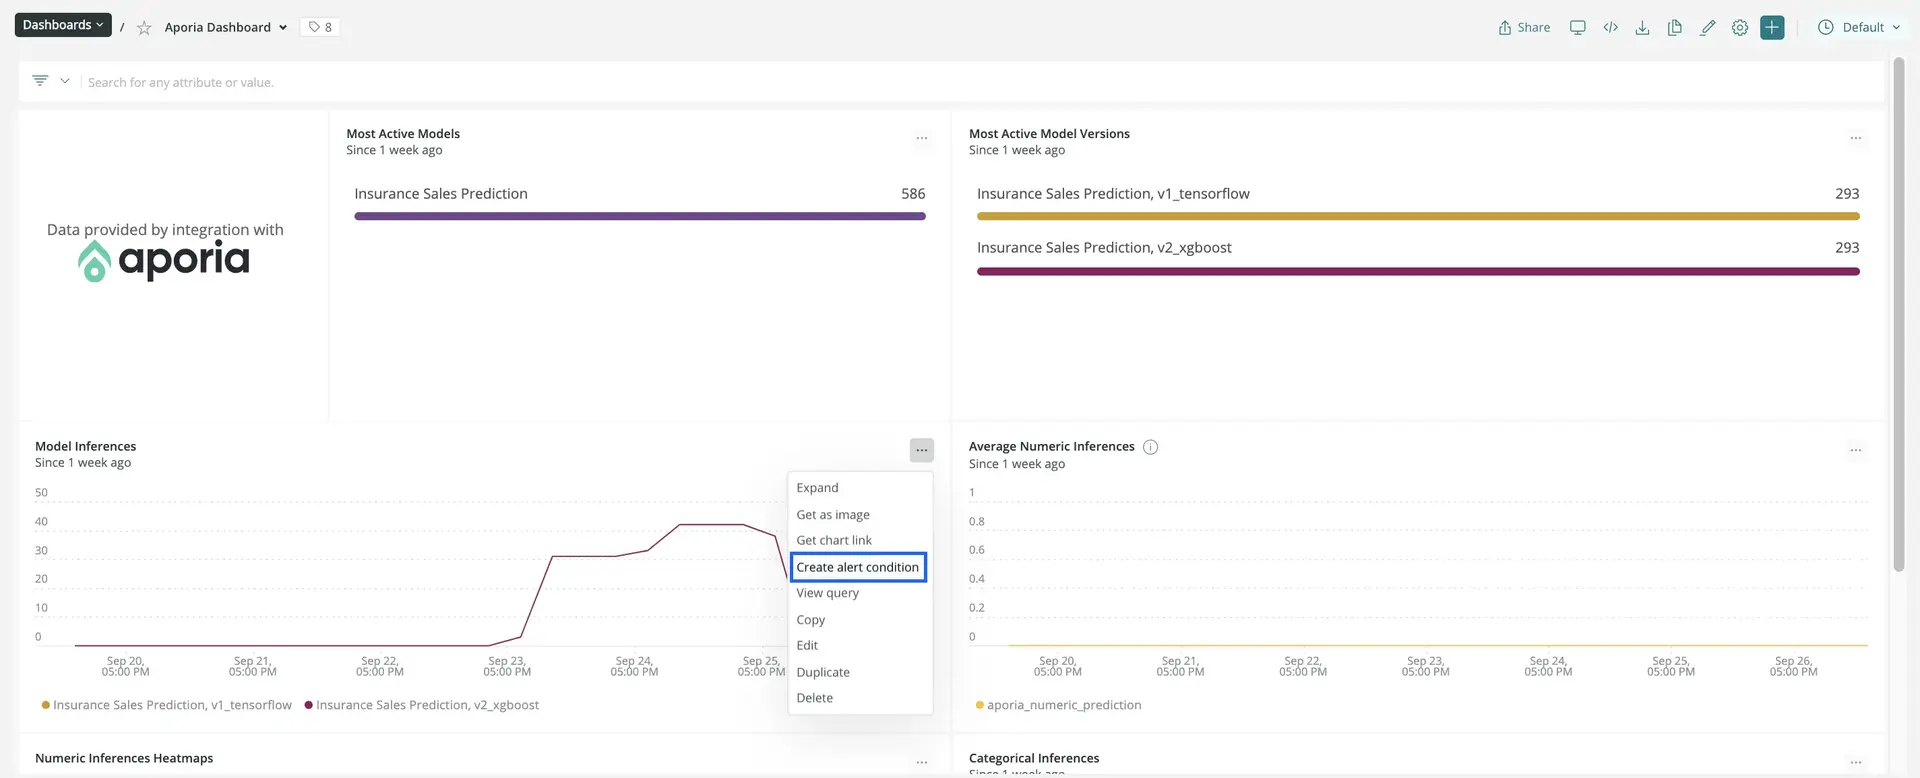
Setup alert notifications: Once you've created some dashboards, you can get alerted on your data. To create a NRQL alerts condition from a chart, click the chart widget, then click Create alert condition. Once you've named and customized your condition, you can add it to an existing policy or create a new one.

Get notified: Once you've created an alerts condition, you can choose how you want to be notified. See our docs on how to set up notification channels.
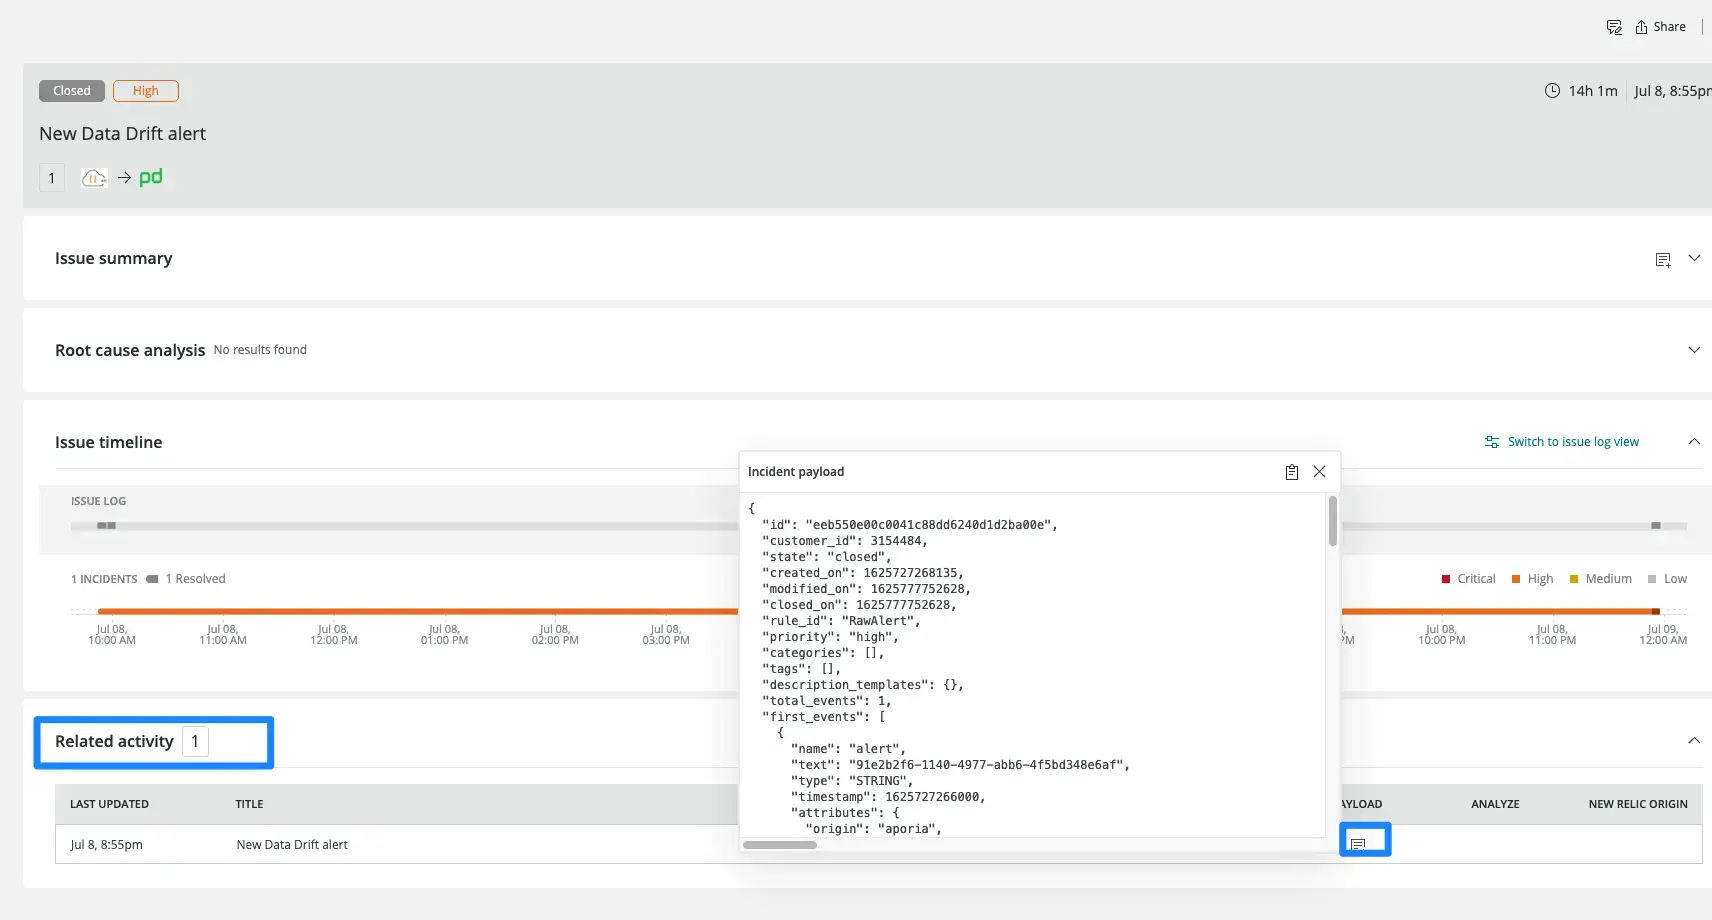
Correlate your incidents: In addition to notifications, you can use incident intelligence to correlate your incidents. See our docs on how to correlate incidents using decisions.
