New Relic's MLOps solution provides a Python library that makes it easy to monitor your machine learning models. New Relic Bring Your Own (BYO) Machine Learning Model Monitoring is an offering of the New Relic product suite that allows users to monitor the performance of their own machine learning models, regardless of the platform or framework they are using. This can help users identify issues with their models and take corrective action before those issues impact the accuracy or performance of their applications.
In an increasingly complex digital space, data teams rely heavily on prediction engines to make decisions. New Relic Machine Learning Model Monitoring allows your team to take a step back and look at the whole picture. Our model performance monitoring allows your team to examine your ML models to identify issues efficiently and make decisions by leveraging NR core features like setting alerts on any metrics and get notified once your ML performance has changed
Easy to Integrate
The ml-performance-monitoring python package, based on newrelic-telemetry-sdk-python, allows you to send your model's features and prediction values, as well as custom metrics, by simply adding a few lines to your code.
Use the python package to send the following types of data to New Relic:
- Inference data: Stream your model’s features and prediction values. Inference data is streamed as a custom event named InferenceData.
- Data metrics: Instead of sending all your raw inference data, select the aggregated statistics option over the features and predictions (for example, min, max, average, or percentile). They will be sent automatically as metrics.
- Custom metrics: Calculate your own metrics, monitor your model performance or model data, and stream them to New Relic using the record_metrics function. They will be sent as metrics.
View Model Predictions
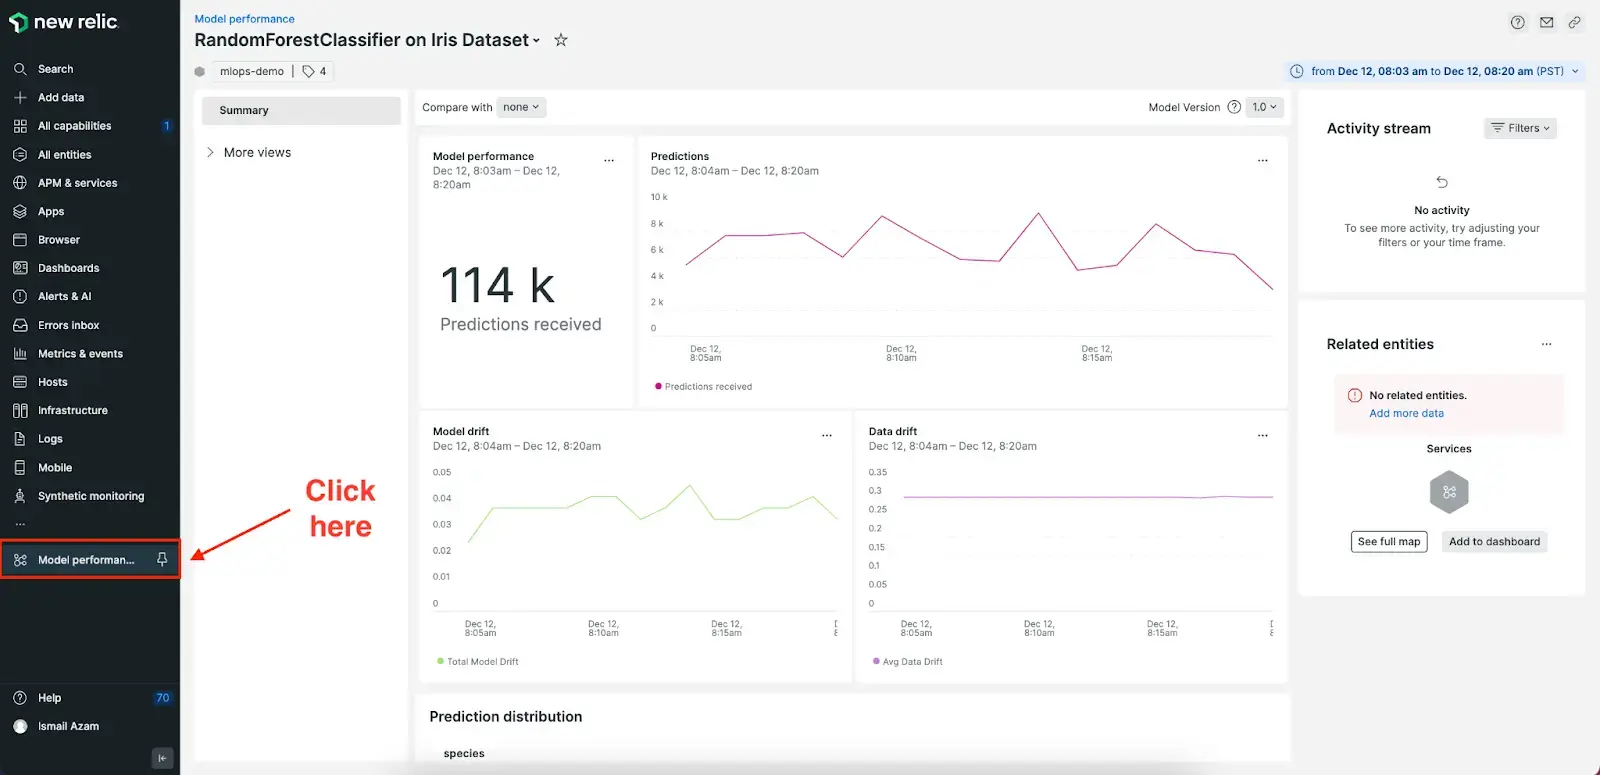
By monitoring the performance of your machine learning models, you can identify any issues that may be impacting their accuracy or performance. You'll see vital information in your dashboard like your total model predictions and distribution over time. Additionally, you can set to track any changes in total predictions or high/low picks.

Detect Model and Data Drift
With real time monitoring, you can quickly identify issues with your machine learning models by detecting model and data drift. Model and data drift are changes in your real world environment that can affect the predictive power of your model. By getting real-time data on your model and data drift, you can quickly take corrective action before those issues impact the performance of your applications.

Dive Deeper into Model Features
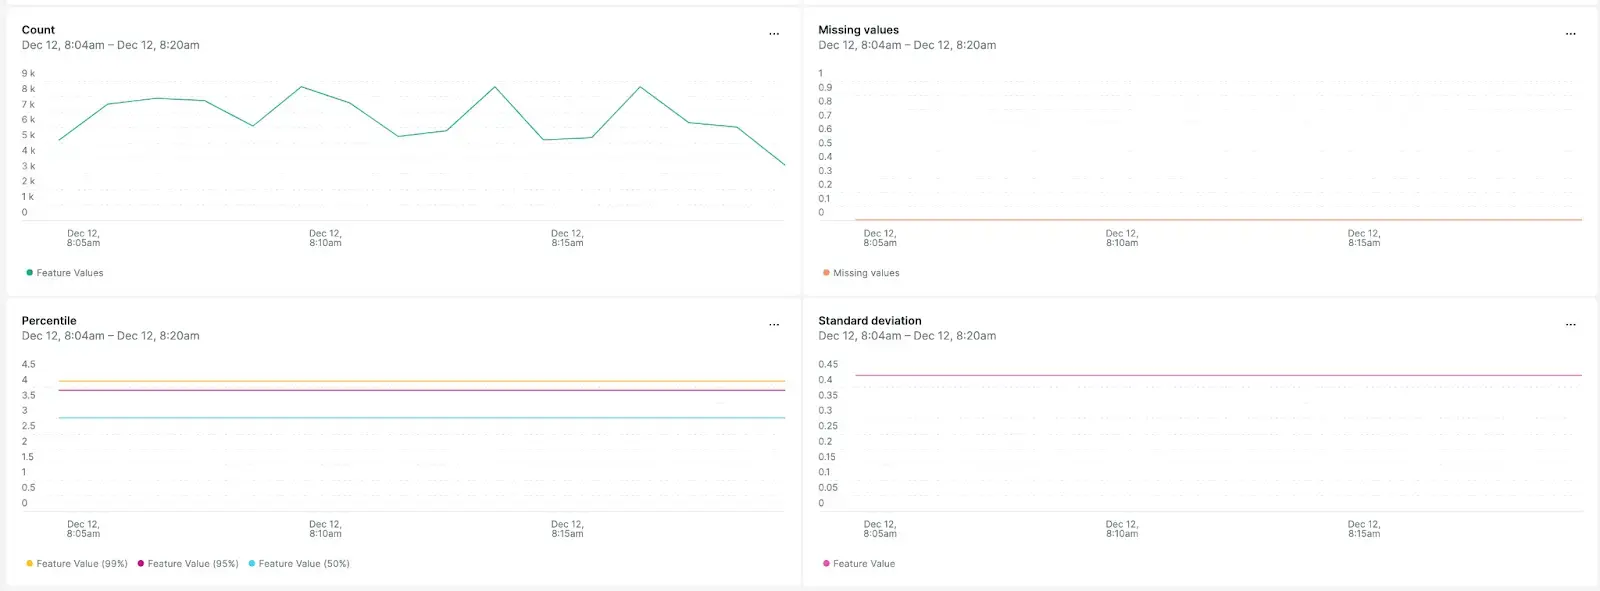
Get insight and statistical data on your features and get alerted on any deviation from standard and expected behavior.


How to start monitoring your ML model performance
First, use the getting started documentation to start streaming your model data. Then, click on Model Performance in the All Capabilities page in the New Relic UI (don't forget to pin it), and you will see your model performance view based on the data your model is sending.
