Garbage collection (GC) finds unused data objects and reclaims that memory space for use by another process. The New Relic Ruby agent can collect information about how much time is spent in garbage collection for applications running on CRuby 1.9.2 or higher or Ruby Enterprise Edition, but you must explicitly enable this feature in your application.
Important
Avoid using garbage collection in production for long periods of time, as it increases overhead.
Enable garbage collection instrumentation
To activate the feature, add the appropriate call in your application initialization.
- CRuby 1.9.2 or higher:
GC::Profiler.enable - Ruby Enterprise Edition:
GC.enable_stats
For Rails applications, you can either add this call to an initializer in config/initializers, or add it directly to your config/application.rb file.
View app-wide GC statistics
To view overall garbage collection statistics:
- Log into New Relic, select a Ruby app, and go to Summary.
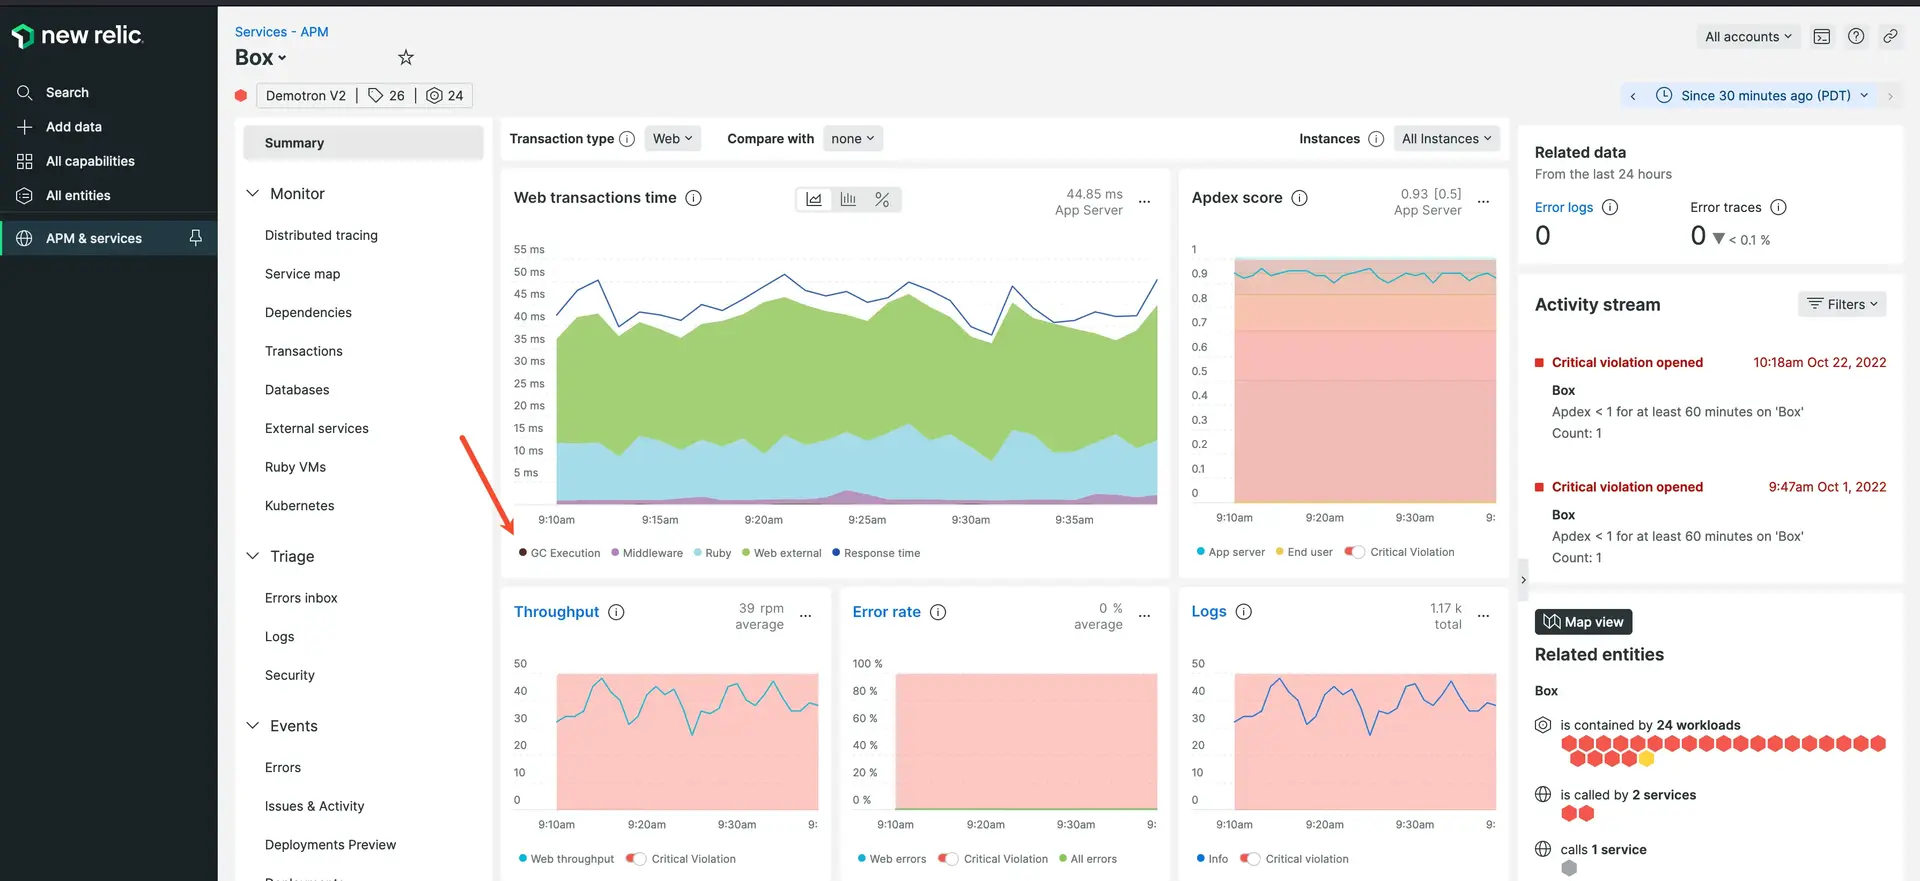
- From the APM Summary page, look for GC Execution statistics on the Web transactions time chart.

one.newrelic.com > All capabilities > APM & services > (select a Ruby app) > Summary: On the Web transactions time chart, garbage collection statistics are labeled GC Execution.
View detailed GC metrics
To view garbage collection metrics on a per-transaction basis, go to one.newrelic.com > All capabilities > APM & services > (select a Ruby app) > Transactions > (select a transaction). You can then view the amount of time spent in GC, and the average number of times GC is called for each transaction. Hide other labels for a detailed view of garbage collection.
Detailed information includes:
Garbage collection details | Comments |
|---|---|
Trend of garbage collection time | Garbage collection usually takes a small amount of time, and therefore the trend line may not be visible in your charts. To view the trend in garbage collection time, navigate to the overview chart or to detailed transaction metrics. Then, hide every chart label except GC Execution by selecting each label. |
Average number of calls | To view the average number of garbage collection calls for each controller action: From your APM Summary page, select Transaction. Then select a controller action and view the App Server Breakdown. |