Distributed tracing tracks and observes service requests as they flow through distributed systems.
Requests might pass through various services to reach completion, and these services could be in a variety of places: containers, serverless environments, virtual machines, different cloud providers, or on-premises. When you can see the path of an entire request across different services, you can quickly pinpoint failures or performance issues.
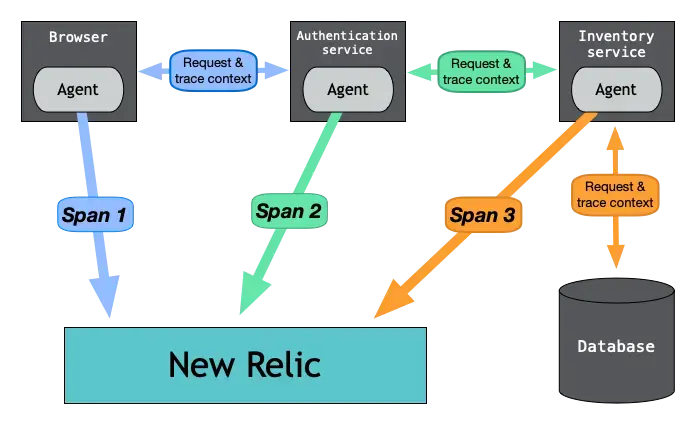
Distributed tracing collects data as requests travel from one service to another, recording each segment of the journey as a span. These spans contain important details about each segment of the request and are eventually combined into one trace. The completed trace gives you a picture of the entire request.

Here is an example of a web transaction where agents measure the time spent in each service. Agents then send that timing information to New Relic as spans, and the spans are combined into one distributed trace.
Get started
See these distributed tracing topics: