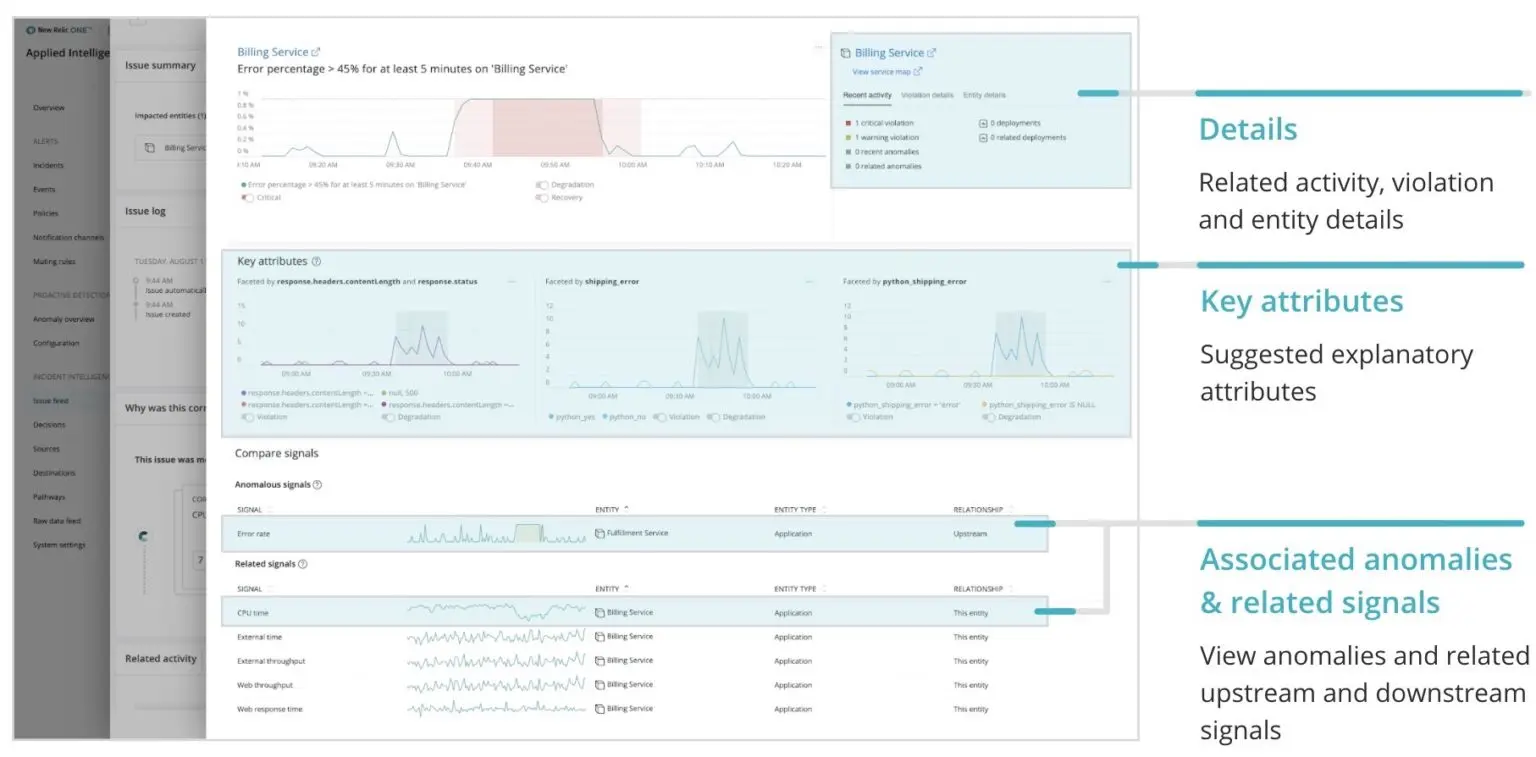
Dig deeper into alerts you receive with automatic alert analysis, which provides context and an explanation about each alert incident. You can also get a structured view and additional information about the entity and what was happening around it when the threshold was crossed to help you troubleshoot even faster. Alert analysis includes:
- A chart of the incident
- Details about recent activity, the incident, and the entity
- A suggestion of key attributes that may explain the alert
- A comparison of signals showing associated anomalies (if you’ve configured Proactive Detection) and related signals for this specific entity, such as CPU, throughput, and more, that occurred around the same time as the alert incident

To view an alert analysis, in the one.newrelic.com top nav, click Alerts & AI, then in the side nav under Incident Intelligence click Issue Feed.
When you open an issue, you’ll find Related Activity. If you want to dig into a detailed analysis of the alert, click Analyze.
If you’re familiar with the Proactive Detection analyze anomaly page, this will look very familiar, as its information is structured in the same layout. In the upper left, you’ll see a chart of the alert incident. To get started, you’ll need to configure Incident Intelligence within our Applied Intelligence. Alert analysis integrates with Proactive Detection and Incident Intelligence, so if you want additional context—such as related anomalies—you’ll want to configure Proactive Detection.
To get started with Applied Intelligence, sign up for a free New Relic account and get 1,000 Incident Intelligence events free every month.