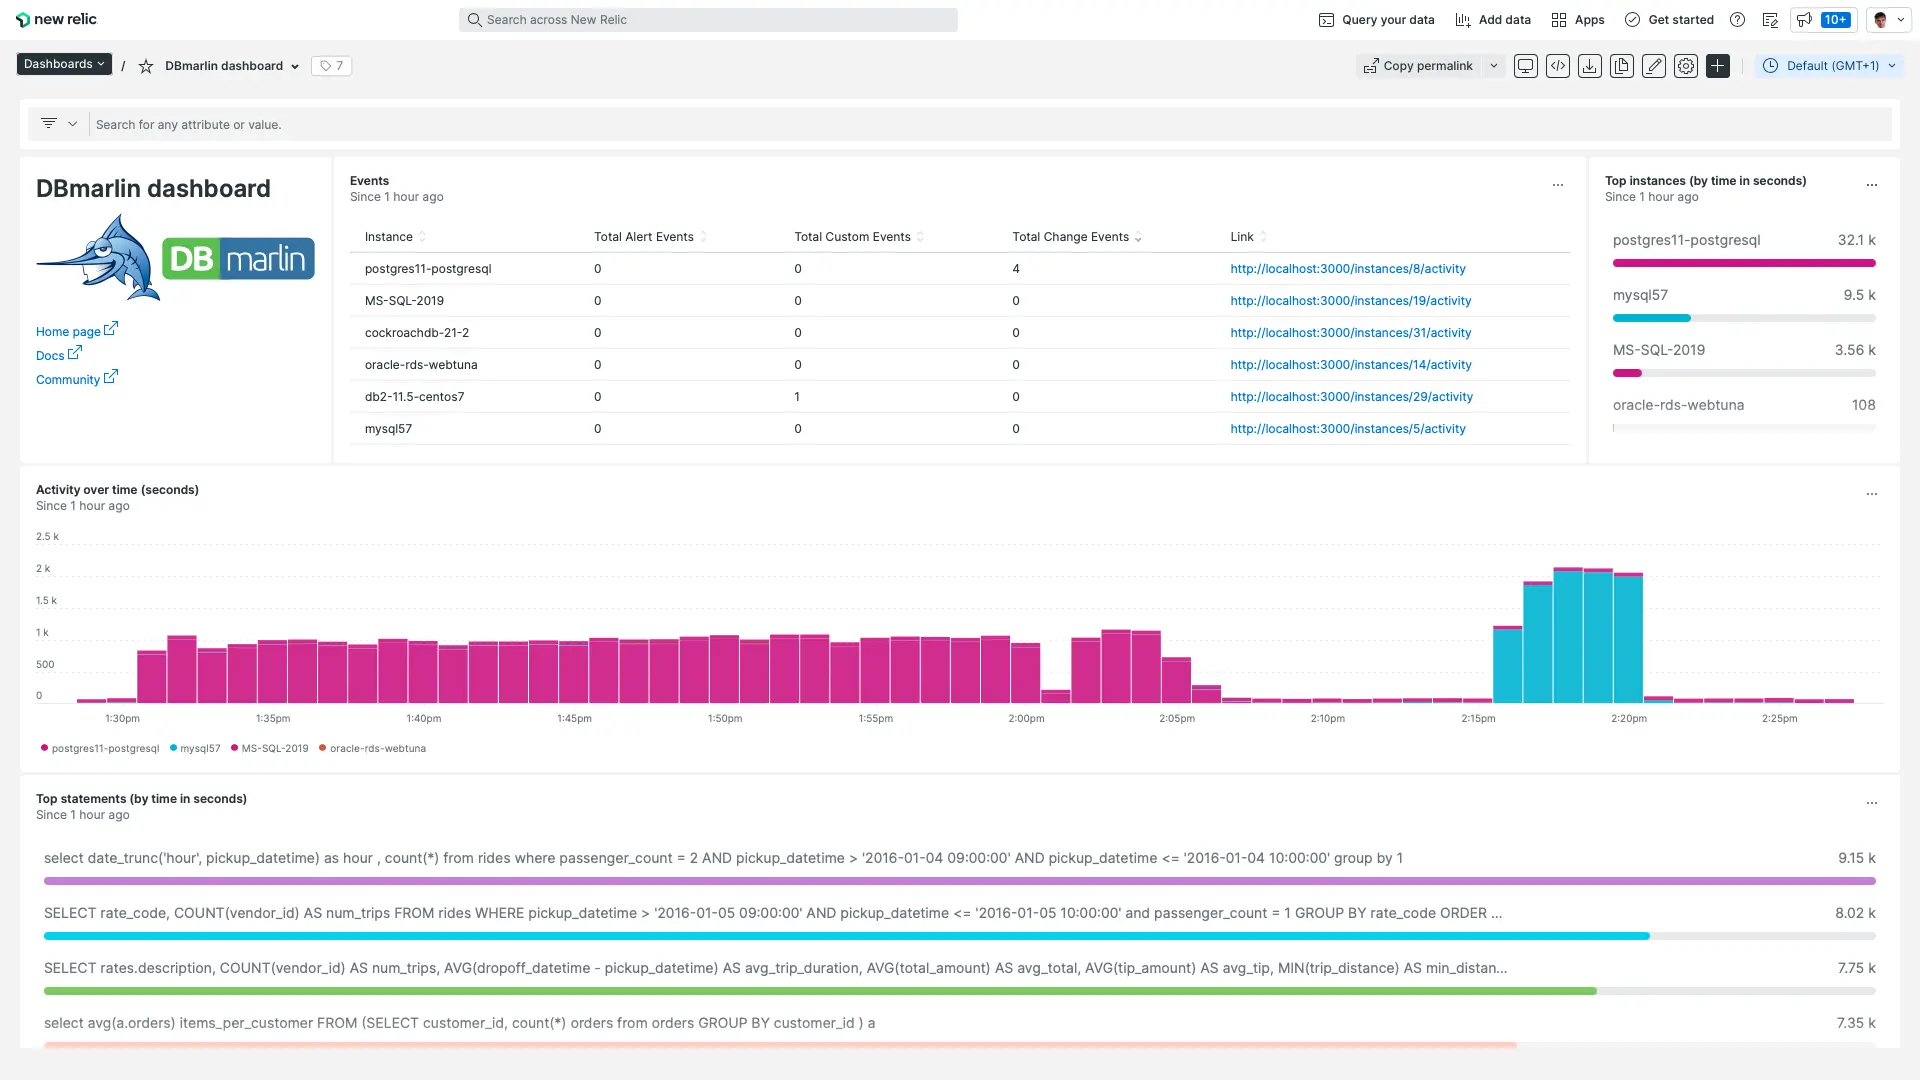
The new DBmarlin integration and the DBmarlin quickstart dashboard for New Relic make it easier to monitor the functionality and performance of your databases alongside the rest of your observability data.
DBmarlin brings deep database performance and change monitoring to the New Relic platform so that developers, testers, SRE engineers as well as database administrators can understand why database performance is slow and how to improve it.
The quickstart sends database performance data, including database time, top SQL statements, and top wait events, from DBmarlin to New Relic. It also comes with a pre-built dashboard so you can see when database slowdowns occur and what is causing them.

Benefits
- Monitor database performance, track changes, and help your databases run fast.
- Easy and consistent monitoring for CockroachDB, DB2, MariaDB, MySQL, Oracle, PostgreSQL and SQL Server, self-hosted or in the cloud.
- See how changes to your code, user load, infrastructure, or some other event impacts performance.
- Capture SQL statement text and wait events so you can see exactly where the time is spent executing SQL within your database.
- Auto-detect changes to schema objects, database parameters, and execution plans so you can see their impact on performance.
Get started
You can send data to New Relic with DBmarlin v2.7 and above. This allows you to monitor database performance data within a customizable New Relic quickstart dashboard alongside the rest of your stack.
- Install the quickstart.
- Claim a free premium copy of DBmarlin that can be applied to any supported database.
- Before installing the integration you'll need to install DBmarlin. If you haven't already installed DBmarlin, see the install instructions.
- Read the DBmarlin blog to learn more about version 2.7 of DBmarlin and the New Relic integration.
- Check out the Explorers Hub post.