A maioria dos aplicativos depende do Redis para as coisas que precisam ser rápidas, como armazenamento em cache, armazenamento de sessão, placares de líderes em tempo real e fila de mensagens. Mas quando o Redis fica lento, você geralmente percebe isso em outro lugar primeiro, como uma página lenta ou uma solicitação que atinge o tempo limite. Sem uma boa visibilidade, é difícil dizer se o problema real é a memória acabando, chaves sendo removidas de forma muito agressiva, uma queda na taxa de ocorrência no cache ou uma réplica que ficou para trás.
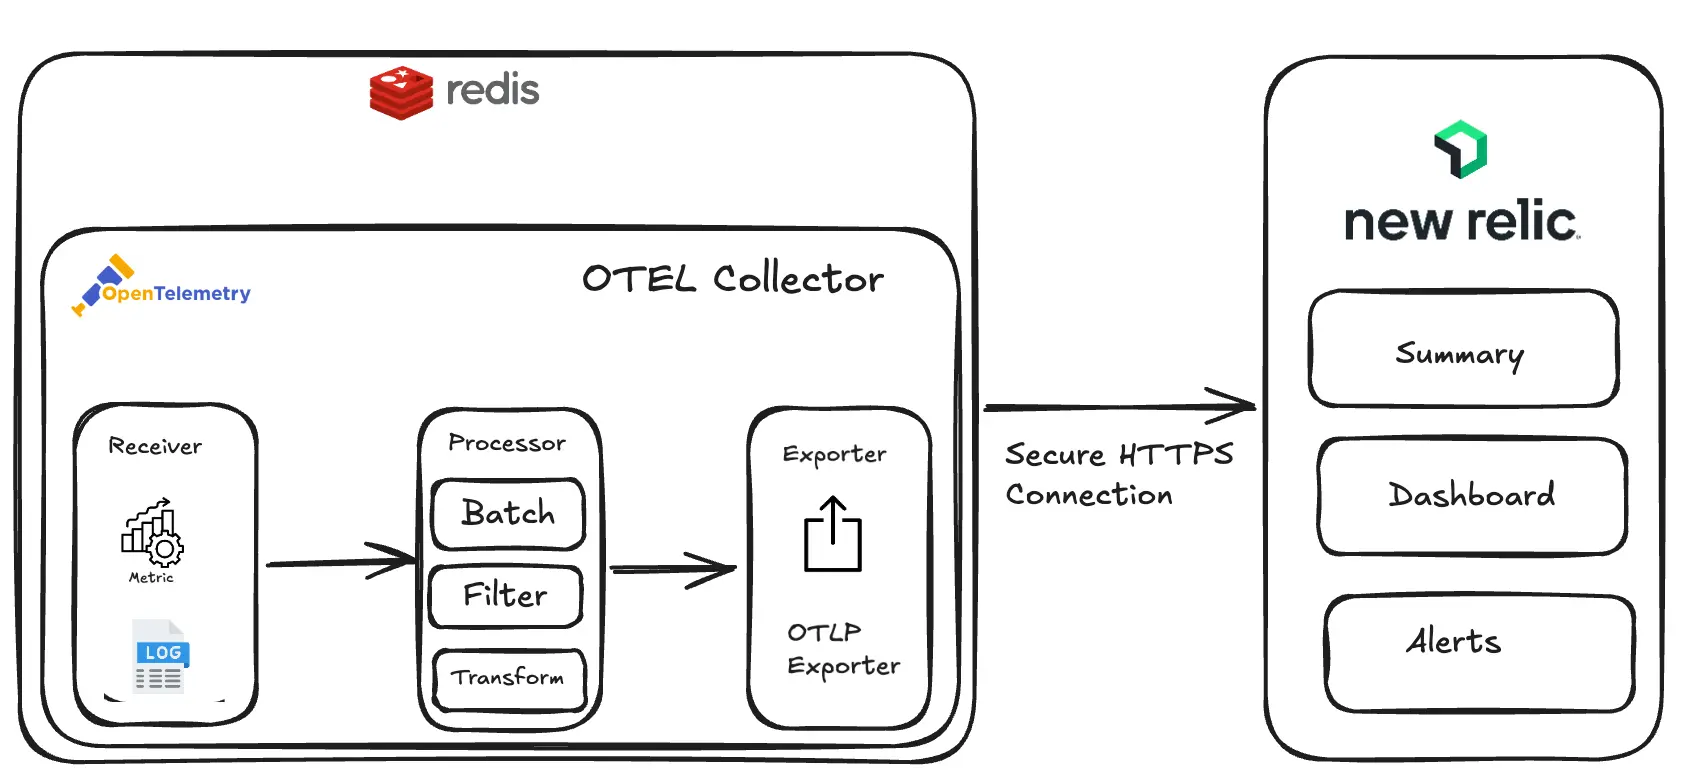
O New Relic fornece um caminho de monitoramento baseado no OpenTelemetry para o Redis. O receptor do Redis do OpenTelemetry Collector coleta as métricas que o Redis expõe por meio de seu comando INFO e as envia para o New Relic, sem exigir um agente separado. O New Relic sintetiza cada instância do Redis como sua própria entidade, agrupa implantações em cluster sob uma entidade de Cluster do Redis e fornece dashboards e alertas pré-criados.
Dica
Se você estiver procurando pela integração no host tradicional do New Relic Redis (nri-redis), consulte a integração de monitoramento do Redis.
Arquitetura
Iniciar
Para monitorar o Redis com o OpenTelemetry, conclua três etapas: revise os pré-requisitos, configure o coletor e visualize seus dados.
Pré-requisitos
Certifique-se de que seu ambiente atenda a todos os requisitos para a integração definida para sua implantação:
- Para auto-hospedado
- Para o Docker
- Para Kubernetes
Configuração do Collector
Escolha seu caminho de instalação com base em sua infraestrutura:
- Para Auto-hospedado
- Para Docker
- Para Kubernetes
Ver seus dados
Depois de concluir a configuração do coletor, você pode visualizar suas métricas do Redis no New Relic, consultá-las com NRQL, criar dashboards e configurar alertas. Para obter mais informações, consulte a documentação encontrar e consultar seus dados.
A integração do Redis da New Relic rastreia uma grande variedade de métricas. Para saber mais sobre os tipos de dados e atributos suportados, consulte o guia de referência de métricas do Redis.
Próximos passos
Após instalar a integração:
- Visualize seus dados: Explore o dashboard, execute consultas NRQL e configure alertas para suas métricas do Redis.
- Consulte a referência de métricas: entenda todas as métricas disponíveis e seus atributos.
- Solucionar problemas: Resolva problemas comuns com a coleta de dados e a síntese de entidades.