최신 엔터프라이즈 아키텍처는 결제 처리, 주문 라우팅, 서비스 동기화 매칭과 같은 중요한 작업을 처리하기 위해 메시지 기반 애플리케이션에 크게 의존합니다. 그러나 이러한 메시지 백본이 확장됨에 따라 성능 저하를 추적하는 것은 복잡해집니다. 애플리케이션이 갑자기 느려진다고 상상해 보십시오 ― 깊은 가시성이 없다면 지연이 애플리케이션 소비자 때문인지 아니면 IBM MQ 대기열 백로그 때문인지 정확히 파악하는 것은 매우 어려울 수 있습니다.
뉴렐릭은 IBM MQ 큐 관리자를 위한 순수 OpenTelemetry 모니터링 경로를 제공하여 이러한 옵저버빌리티 격차를 해소할 수 있도록 지원합니다. IBM MQ 팀의 공식 mq-metric-samples Prometheus 익스포터를 활용하여, OpenTelemetry Collector는 원시 텔레메트리를 수집하고 뉴렐릭의 데이터베이스에 직접 구성합니다. 각 큐 관리자는 고유한 IBMMQ_MANAGER 엔티티로 자동 표시되고 해당 큐는 하위 IBMMQ_QUEUE 엔티티로 매핑되므로, 독점 에이전트 없이도 사전 구축된 대시보드, 알림 및 시스템의 골든 시그널에 즉시 액세스할 수 있습니다.
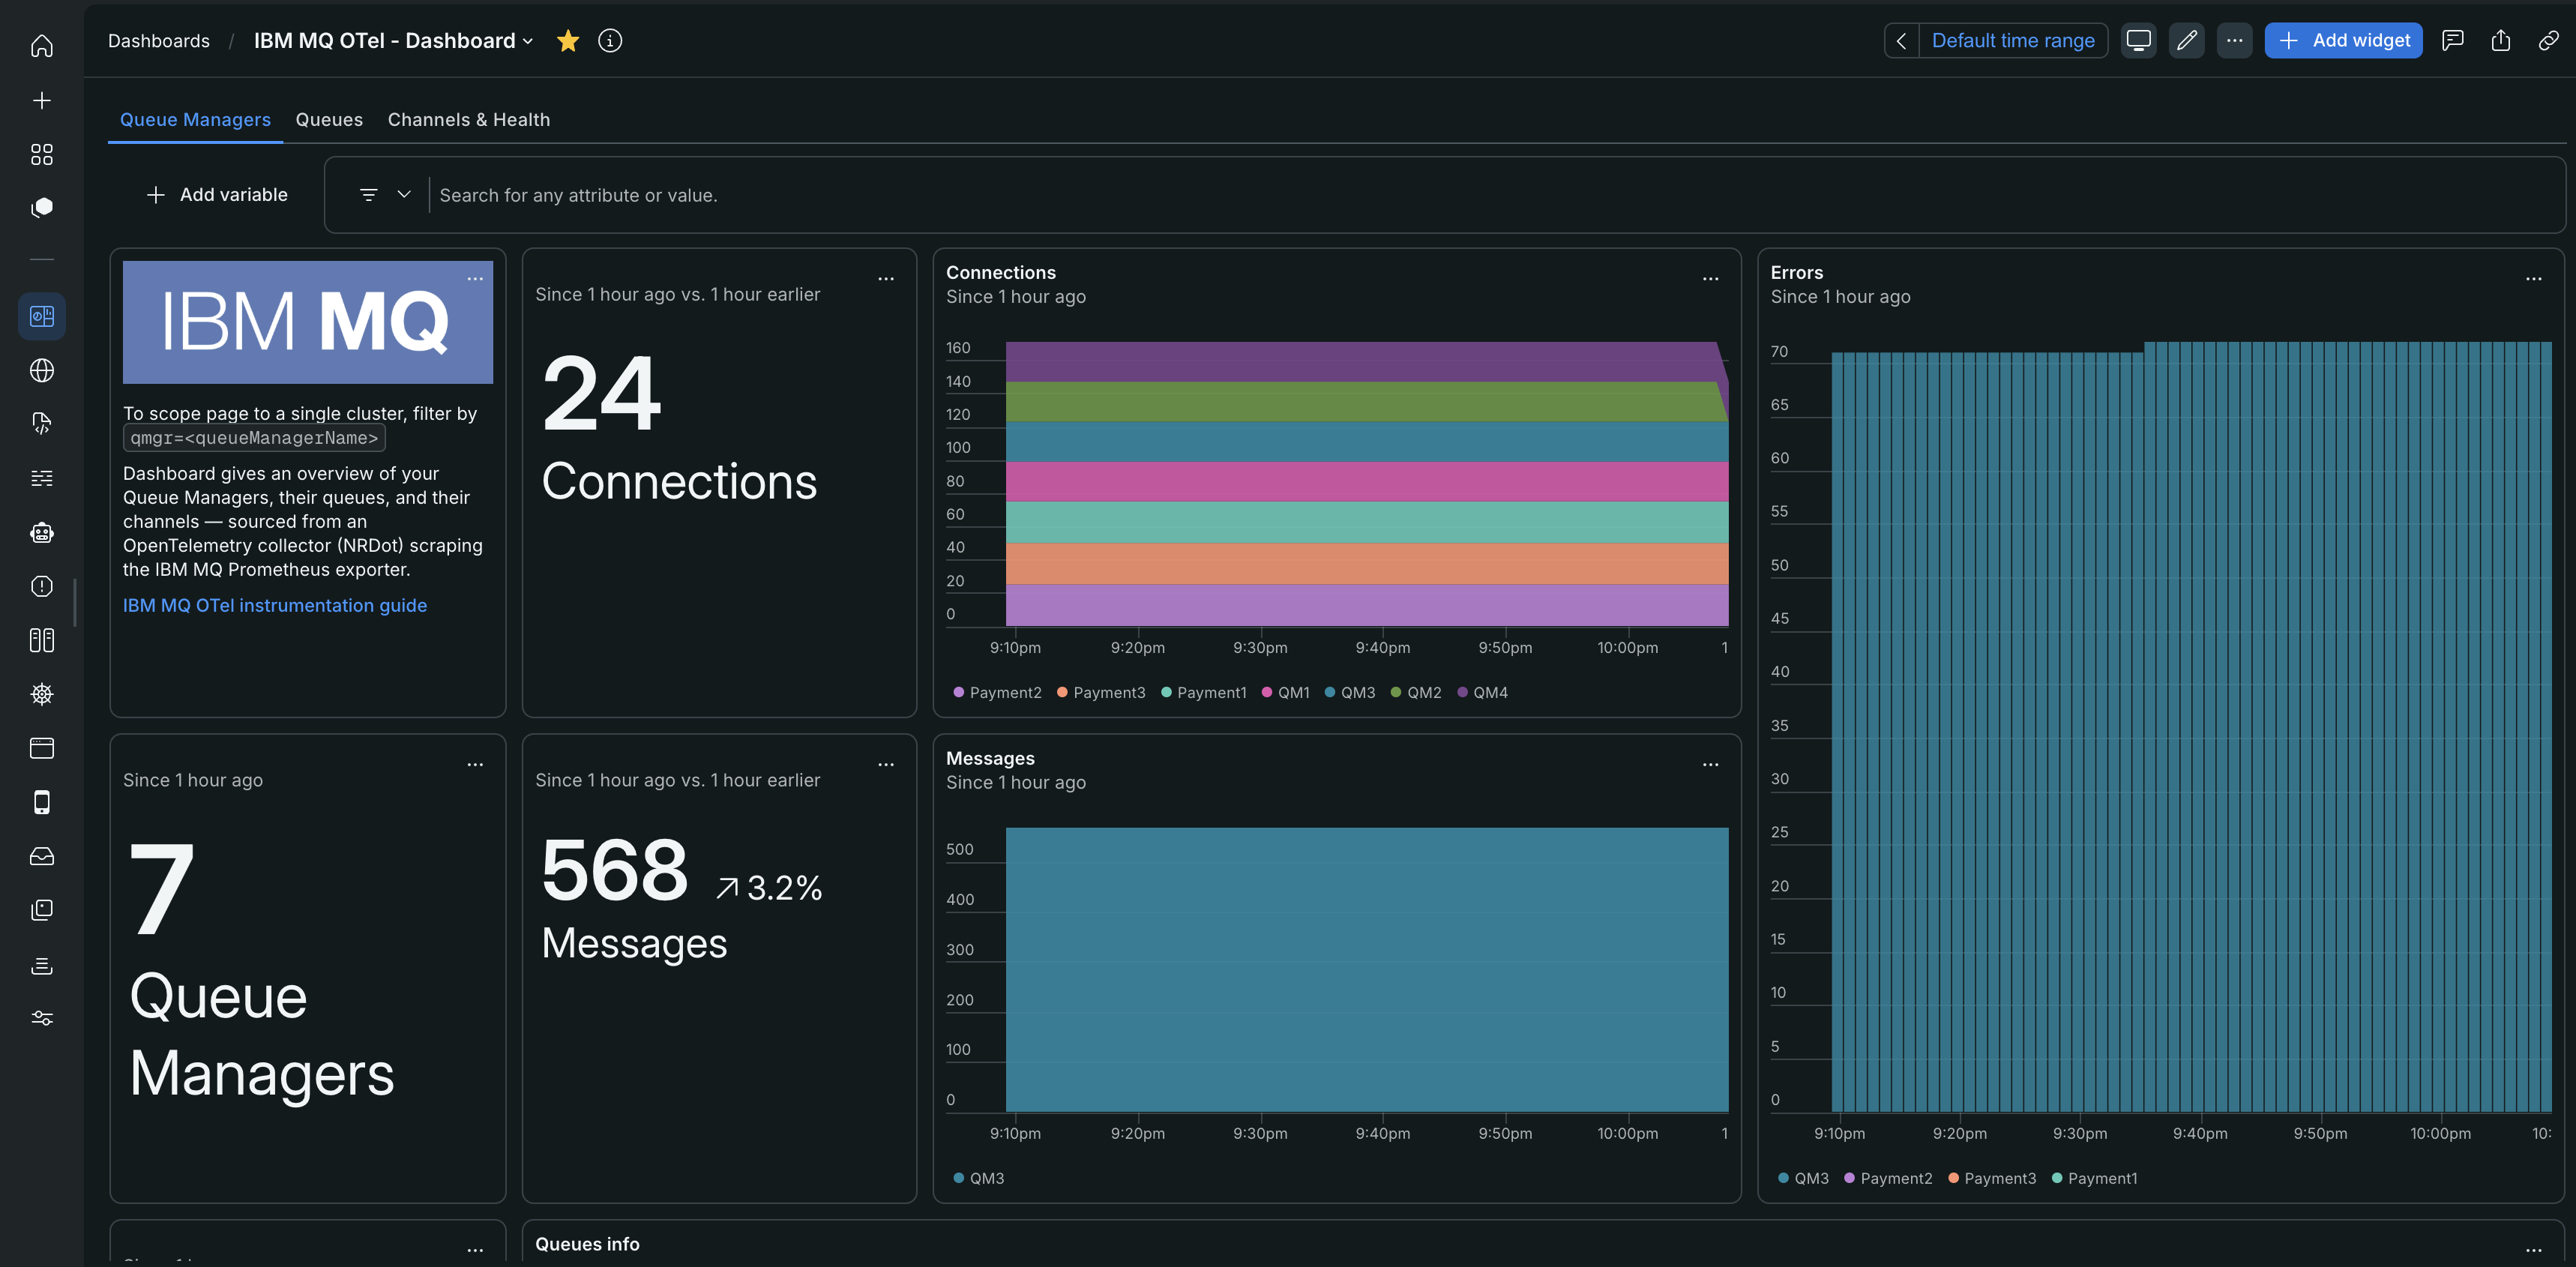
뉴렐릭 IBM MQ 대시보드에서 큐 관리자 상태, 연결, 메시지 처리량 및 큐 깊이를 시각화합니다.
주요 특징들
뉴렐릭 IBM MQ OpenTelemetry 통합은 독점 에이전트의 오버헤드 없이 메시징 인프라에 대한 심층적이고 공급업체 비종속적인 가시성을 제공합니다. 이 통합을 구현하면 비동기 시스템을 원활하게 실행하도록 설계된 4가지 핵심 모니터링 기능을 사용할 수 있습니다:
자동화된 백로그 방지 및 알림: 메시지 전달 경로의 사각지대를 제거합니다. 메시징 백본에 의존하는 다운스트림 애플리케이션에서 지연을 일으키기 전에 병목현상을 포착하기 위해 증가하는 큐 깊이, 커밋되지 않은 메시지 급증 및 지연된 채널에 대한 활성 알림을 구성할 수 있습니다.
세분화된 처리량 및 성능 최적화: 메시지 처리 속도가 느려지는 위치를 정확히 격리합니다. 연결 수 및 대기열 대기 시간과 함께 실시간 MQPUT 및 MQGET 속도를 추적하여, 처리 마찰이 IBM MQ 브로커 자체에 있는지 아니면 느린 애플리케이션 소비자에 있는지 빠르게 확인할 수 있습니다.
사전 예방적 용량 및 리소스 사이징: 인프라 확장에 대한 추측을 배제합니다. 이 통합은 중요한 호스트 수준 브로커 메트릭 ― 활성 로그 파일 크기 임계값, 파일 시스템 사용량 및 열린 핸들 추세 포함 ― 을 표시하여 리소스 고갈로 인해 브로커 충돌이 발생하기 전에 큐 관리자를 사전에 확장할 수 있도록 합니다.
안정적인 전송 및 데드 레터 큐(DLQ) 추적: 트랜잭션 데이터 무결성을 보호합니다. 채널 상태 변경을 즉시 모니터하고, 데드 레터 큐 누적을 추적하며, 실패한 MQI 호출을 조기에 포착하여 데이터가 영구적으로 손실되기 전에 라우팅의 잘못된 설정과 누락을 식별합니다.
작동 원리
텔레메트리 데이터가 수집, 처리 및 모델링되는 방식을 이해하면 모니터링 파이프라인을 최적화하는 데 도움이 됩니다. 다음 섹션에서는 통합이 브로커에서 UI로 데이터를 처리하는 방법을 정확히 분석합니다.
텔레메트리 데이터 흐름
텔레메트리 데이터는 뉴렐릭 내에서 시각화되기 전에 4개의 서로 다른 계층을 순차적으로 거쳐 흐릅니다:
- 브로커 계층: 각 IBM MQ 큐 관리자는 PCF(Programmable Command Format)를 사용하여 운영 성능 통계를 기본적으로 추적합니다.
- 익스포터 계층: 필수
mq-metric-samples익스포터는 이러한 PCF 통계를 가져와 표준 HTTP/metricsPrometheus 엔드포인트에 노출합니다. 각 설정 가이드는 이 구성 요소가 클러스터에서 이미 실행 중이라고 가정합니다. - Collector 계층: 익스포터의 엔드포인트를 스크랩하도록 OpenTelemetry Collector를 설정합니다. 수집기는 백그라운드 노이즈를 필터링하고, ID 태그의 형식을 지정하며, 정리된 OTLP 데이터를 뉴렐릭으로 전달합니다.
- 합성 계층: 뉴렐릭은 OTLP 페이로드를 수신하고 데이터를 읽기 쉽고 탐색 가능한 IBM MQ 작업 공간 엔티티로 자동 매핑합니다.
파이프라인 처리 체인
데이터를 깨끗하게 유지하고 수집 속도를 최적화하기 위해, 수집기가 수집한 모든 메트릭은 config.yaml 파일 내에서 자동화되고 순서에 민감한 처리 시퀀스를 거칩니다:
- Prometheus Ingest: 실행 중인 익스포터에서 원시 Prometheus
/metrics엔드포인트를 스크랩합니다. - 오버헤드 필터: 볼륨 노이즈를 최소화하기 위해 익스포터 자체 메트릭 및 백그라운드 추적 주기를 삭제합니다.
- 큐 필터: 활성 성능 추적이 필요하지 않은 내부 시스템 큐를 걸러냅니다.
- 리소스 감지: 페이로드에 호스트 인프라 ID 태그 및 환경 메타데이터를 기록합니다.
- 레이블 변환: 원시 Prometheus 레이블을 표준 점 표기 OTel 형식으로 정규화합니다. 예를 들어
targetName을(를)target.name(으)로 다시 매핑합니다. - 메모리 제한기: 호스트 안정성을 보호하기 위해 수집기 프로세스에 엄격한 메모리 캡슐 버퍼를 적용합니다.
- 누적-델타 변환: 절대적이고 연속적인 Prometheus 메트릭 카운터를 명확한 델타 값으로 변환합니다.
- 일괄 번들링: 네트워크 효율성을 극대화하기 위해 개별 텔레메트리 이벤트를 일괄 처리된 OTLP 페이로드로 그룹화합니다.
- OTLP HTTP Export: 최종 압축된 데이터 블록을 뉴렐릭 데이터 수집 시스템으로 직접 전송합니다.
Collector 배포 옵션
뉴렐릭은 IBM MQ 통합을 위해 두 가지 OpenTelemetry Collector 배포판을 완벽하게 지원합니다. 두 옵션 모두 동일한 기능적 역량을 제공하며 동일한 핵심 설정 파일을 공유합니다:
- NRDOT Collector(권장): 뉴렐릭 기술 지원의 직접적인 지원을 받는 뉴렐릭의 선별된 OpenTelemetry Collector 배포판입니다. NRDOT Collector GitHub 저장소에서 오픈 소스 코드베이스를 검토하세요.
- OpenTelemetry Collector: 업스트림 CNCF 커뮤니티 배포판입니다. OpenTelemetry Collector Contrib GitHub 저장소에서 프로젝트 세부 정보를 확인하세요.
IBM MQ 엔티티 모델
뉴렐릭은 텔레메트리 스트림 내의 특정 마커를 평가하여 원시 데이터를 엔티티로 자동 합성합니다:
ibmmq_qmgr_status과(와) 같은 원시 밑줄 메트릭 이름 및ibmmq_queue_depth- 구조적
qmgr및queue데이터 레이블 - 수집기 설정에 따른
target.name식별 속성
이러한 규칙을 사용하여 플랫폼은 데이터를 명확한 부모-자식 구조로 구성합니다:
| 엔티티 유형 | 복합 ID 키 | 핵심 표현 |
|---|---|---|
IBMMQ_MANAGER | target.name:qmgr | 단일 큐 관리자를 나타냅니다. 예를 들어, prod-mq-01:QM1 |
IBMMQ_QUEUE | target.name:qmgr:queue | 관리자 내부에 중첩된 단일 메시지 대기열을 나타냅니다 |
주의
메트릭 이름이나 qmgr 및 queue 레이블의 이름을 변경하지 마십시오. 뉴렐릭은 작업 공간을 자동으로 합성하기 위해 원시 Prometheus 밑줄 형식(ibmmq_*)에 의존합니다. 이러한 이름을 변경하거나 점 표기법으로 변환하면 통합이 손상되어 빈 대시보드가 표시됩니다. 유일한 예외는 targetName 및 clusterName 스크랩 레이블이며, 플랫폼 조회 키를 충족하기 위해 target.name 및 cluster.name 에 매핑되어야 합니다.
시작하다
IBM MQ 모니터링 파이프라인을 설정하는 데는 세 가지 주요 구현 단계가 포함됩니다.
데이터 보기
수집기 설정을 완료하면, 뉴렐릭에서 IBM MQ 메트릭을 보고, NRQL로 쿼리하고, 대시보드를 구축하고, 알림을 설정할 수 있습니다. 자세한 내용은 데이터 보기 및 쿼리 문서를 참조하십시오.
중요
뉴렐릭 IBM MQ 통합은 다양한 브로커 메트릭을 추적합니다. 지원되는 데이터 유형 및 속성에 대해 자세히 알아보려면 IBM MQ 메트릭 참조 가이드를 참조하세요.