Install the Kubernetes integration

New Relic's Kubernetes integration gives you full observability into the health and performance of your infrastructure. With this agent you can collect telemetry data from your cluster using several New Relic integrations such as the Kubernetes events integration, the Prometheus agent, the nri-kubernetes, and the New Relic Logs Kubernetes plugin.
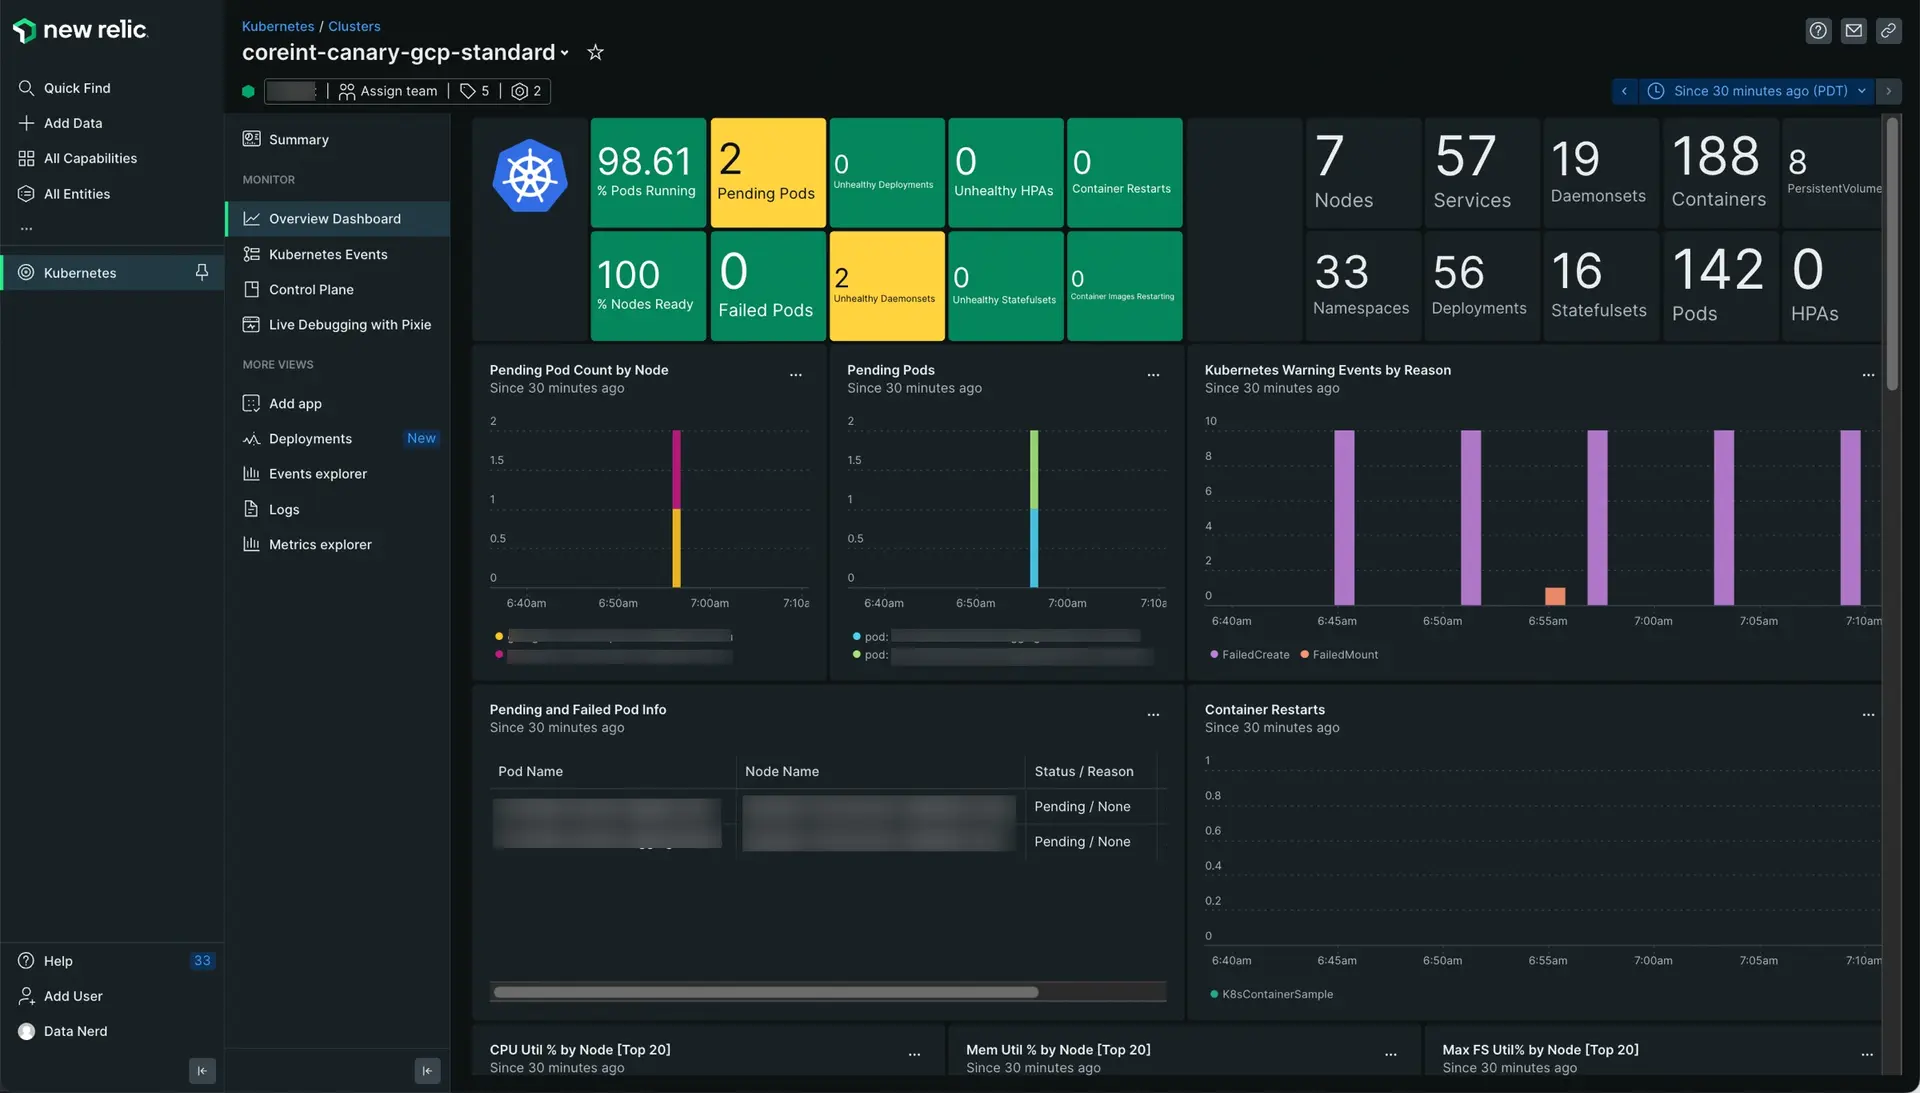
Screenshot showing the Overview dashboard

Go to one.newrelic.com > All capabilities > Kubernetes. Select your cluster and click Overview Dashboard in the left navigation pane. See Explore your Kubernetes cluster for more info.

Important

If you're going to install the New Relic Kubernetes integration on Windows or EKS Fargate, see the Install Kubernetes on Windows and Install Kubernetes on AWS EKS Fargate documents.

Follow these steps to install the New Relic Kubernetes integration.

Before you begin

  • You need a New Relic . You can set up a free account, no credit card required.

  • Be sure you're using a supported Kubernetes version and distribution, check out the compatibility and requirements page. You'll also find specific requirements for Helm and Manifest.

Specific requirements

Depending on where you store your clusters, there are different integration specifications:

Choose your instrumentation method

Install the Kubernetes integration

New Relic has many Helm charts for the different components, each with its own set of features for the platform. You can install these components separately, but we really recommend using the nri-bundle chart. New Relic provides this chart, which works as a wrapper or a meta-package containing the individual charts.

To install nri-bundle with Helm follow these steps:

  1. Make sure kubectl is installed and configured correctly to manage the cluster.

  2. Use this command to add the New Relic Helm charts repo:

    bash
    $
    helm repo add newrelic https://helm-charts.newrelic.com
  3. Create a file named values-newrelic.yaml, which will be used to define your configuration:

    global:
    licenseKey: _YOUR_NEW_RELIC_LICENSE_KEY_
    cluster: _K8S_CLUSTER_NAME_
    newrelic-prometheus-agent:
    # Automatically scrape prometheus metrics for annotated services in the cluster
    # Collecting prometheus metrics for large clusters might impact data usage significantly
    enabled: true
    nri-metadata-injection:
    # Deploy our webhook to link APM and Kubernetes entities
    enabled: true
    nri-kube-events:
    # Report Kubernetes events
    enabled: true
    newrelic-logging:
    # Report logs for containers running in the cluster
    enabled: true
    kube-state-metrics:
    # Deploy kube-state-metrics in the cluster.
    # Set this to true unless it is already deployed.
    enabled: true

    Important

    All the options you can include in the YAML file are in the nri-bundle chart.

  4. Make sure everything is configured properly in the chart by running the following command. Notice that we're specifying --dry-run and --debug, so nothing will be installed in this step:

    bash
    $
    helm upgrade --install newrelic-bundle newrelic/nri-bundle \
    >
    --namespace newrelic --create-namespace \
    >
    -f values-newrelic.yaml \
    >
    --dry-run \
    >
    --debug

    Please notice and adjust the following flags:

    • global.licenseKey=YOUR_NEW_RELIC_LICENSE_KEY: Must be set to a valid for your account.

    • global.cluster=K8S_CLUSTER_NAME: Used to identify the cluster in the New Relic UI, so should be a descriptive value not used by any other Kubernetes cluster configured in your New Relic account.

    • kube-state-metrics.enabled=true: Set this to true to automatically install Kube State Metrics (KSM). This is required for our integration to run. You can set this to false if KSM is already present in your cluster, even if it's on a different namespace.

    • newrelic-prometheus-agent.enabled=true: Set this to deploy our Prometheus Agent, which automatically collects data from Prometheus endpoints present in the cluster.

    • nri-metadata-injection.enabled=true: Set this to install our minimal webhook, which adds environment variables that, in turn, allows linking applications instrumented with New Relic APM to Kubernetes.

    Our Kubernetes charts have a comprehensive set of flags and settings that you can edit to better meet your specific needs. Please, check our Helm chart to see all the options you have.

  5. Install the Kubernetes integration by running the command without --debug and --dry-run:

    bash
    $
    helm upgrade --install newrelic-bundle newrelic/nri-bundle \
    >
    --namespace newrelic --create-namespace \
    >
    -f values-newrelic.yaml
  6. Run this command to check that pods are deploying and reaching a stable state:

    bash
    $
    kubectl -n newrelic get pods -w
  7. If you're going to instrument a GKE AutoPilot cluster, your Helm command should include the following:

    --set newrelic-infrastructure.controlPlane.enabled=false \
    --set newrelic-infrastructure.kubelet.config.scheme=http \
    --set newrelic-infrastructure.kubelet.config.port=10255 \

    Fluent Bit can use a FileStore volume to prevent data loss or duplicated logs during Fluent Bit pod restarts or redeploys. Google FileStore API needs to be enabled in your GKE project. Check this document to know more about enabling APIs.

    To use FileStore, add the following:

    --set newrelic-logging.fluentBit.persistence.mode=persistentVolume
    --set newrelic-logging.fluentBit.persistence.persistentVolume.storageClass=standard-rwx

    Important

    The use of FileStore will result in additional costs, as charged by Google. See your Google Cloud Admin or the FileStore doc for more info.

    If you don't want to use FileStore, add the following:

    • Set "newrelic-logging.fluentBit.persistence.mode" to "none"
    • Remove "newrelic-logging.fluentBit.persistence.persistentVolume.storageClass"

Find and use data

Once you've finished all the steps, you can test the connection to make sure everything is working properly and view your data.

Testing Kubernetes installation

Tip

Not seeing data? If you completed the steps and are still not seeing data, check out this troubleshooting page.

After the installation, you should see the following in the UI:

  • newrelic-nrk8s-ksm pod.
  • newrelic-nrk8s-kubelet pod for each node in your cluster.
  • newrelic-nrk8s-control-plane pod for each master node in your cluster, if any.
  • newrelic-kube-state-metrics pod, if you included KSM with our installation.
  • newrelic-nri-kube-events pod, if you enabled Kubernetes events reporting.
  • prometheus-agent pod, if you enabled the Prometheus agent integration.
  • newrelic-newrelic-logging pod for each node in your cluster, if you enabled the logging integration.

After deploying this integration, you can add:

  • A default set of recommended alerts conditions and dashboards that you can add to your account. These conditions are grouped into these policies:

    • Kubernetes: To add the default set of recommended alert conditions and a dashboard.
    • Google Kubernetes Engine: To add the default set of recommended Google Kubernetes engine alert conditions and a dashboard.

    Once added, you can customize the alert conditions to meet your needs. See Recommended alert policies for more information about managing them.

  • Pre-built dasboards. Follow these steps to add pre-defined dashboards:

    1. Go to one.newrelic.com > Integrations & Agents.

    2. Select Dashboards to access the pre-built resources.

    3. Search Kubernetes and select the dashboard you want to add.

      Add Kubernetes dashboards
    4. Click Edit if you want to change the account in the popup window that opens.

    5. Click Setup Kubernetes or Skip this step if you already setup this integration.

    6. Click View dashboard, and see your Kubernetes data in New Relic.

    For more on creating dasboards, see our Create custom data visualizations with dashboards doc.