Workloads intelligents unifie automatiquement les capacités autonomes de New Relic dans un environnement unique. Plutôt que de vous obliger à naviguer entre des pages APM, infrastructure ou Errors Inbox distinctes et d'appliquer des filtres manuels, ces expériences intégrées sont pré-ciblées sur votre transaction principale et ses dépendances full-stack.
Outils de triage
Examinez en profondeur les erreurs actives et les anomalies de performance émergentes affectant vos workload.
Erreurs
Accédez à une vue Errors Inbox dédiée pré-filtrée sur toutes les entités de vos workloads. Utilisez ceci pour examiner les groupes d’erreurs, les traces d’appels et les métriques d’impact sur tous les services participants sans quitter le contexte du workload. Pour en savoir plus sur le suivi des erreurs, consultez Errors Inbox.
Lorsque la santé de votre charge de travail se dégrade, consultez d'abord la page Erreurs pour voir si les taux d'erreur ont connu un pic et quels services sont affectés.
Risques de performance (aperçu)
Passez en revue les anomalies détectées de manière proactive et les risques émergents à travers les dépendances de vos workload. Cette boîte de réception met en évidence les changements subtils de performance avant qu’ils ne dépassent les seuils d’alerte standard ou ne perturbent les parcours clients clés.
Vues de monitoring
Explorez des lentilles multidimensionnelles pour analyser les flux de transaction, la santé des dépendances et l'activité opérationnelle.
Transaction 360
Ouvrez un espace de travail interactif de traces distribuées ciblé sur votre transaction principale. Utilisez Transaction 360 pour tracer les chemins d’exécution inter-services, examiner la consommation des ressources de l’hôte et évaluer les limites des services en aval lors d’un dépannage approfondi. Pour en savoir plus sur Transaction 360, consultez la documentation de Transaction 360.
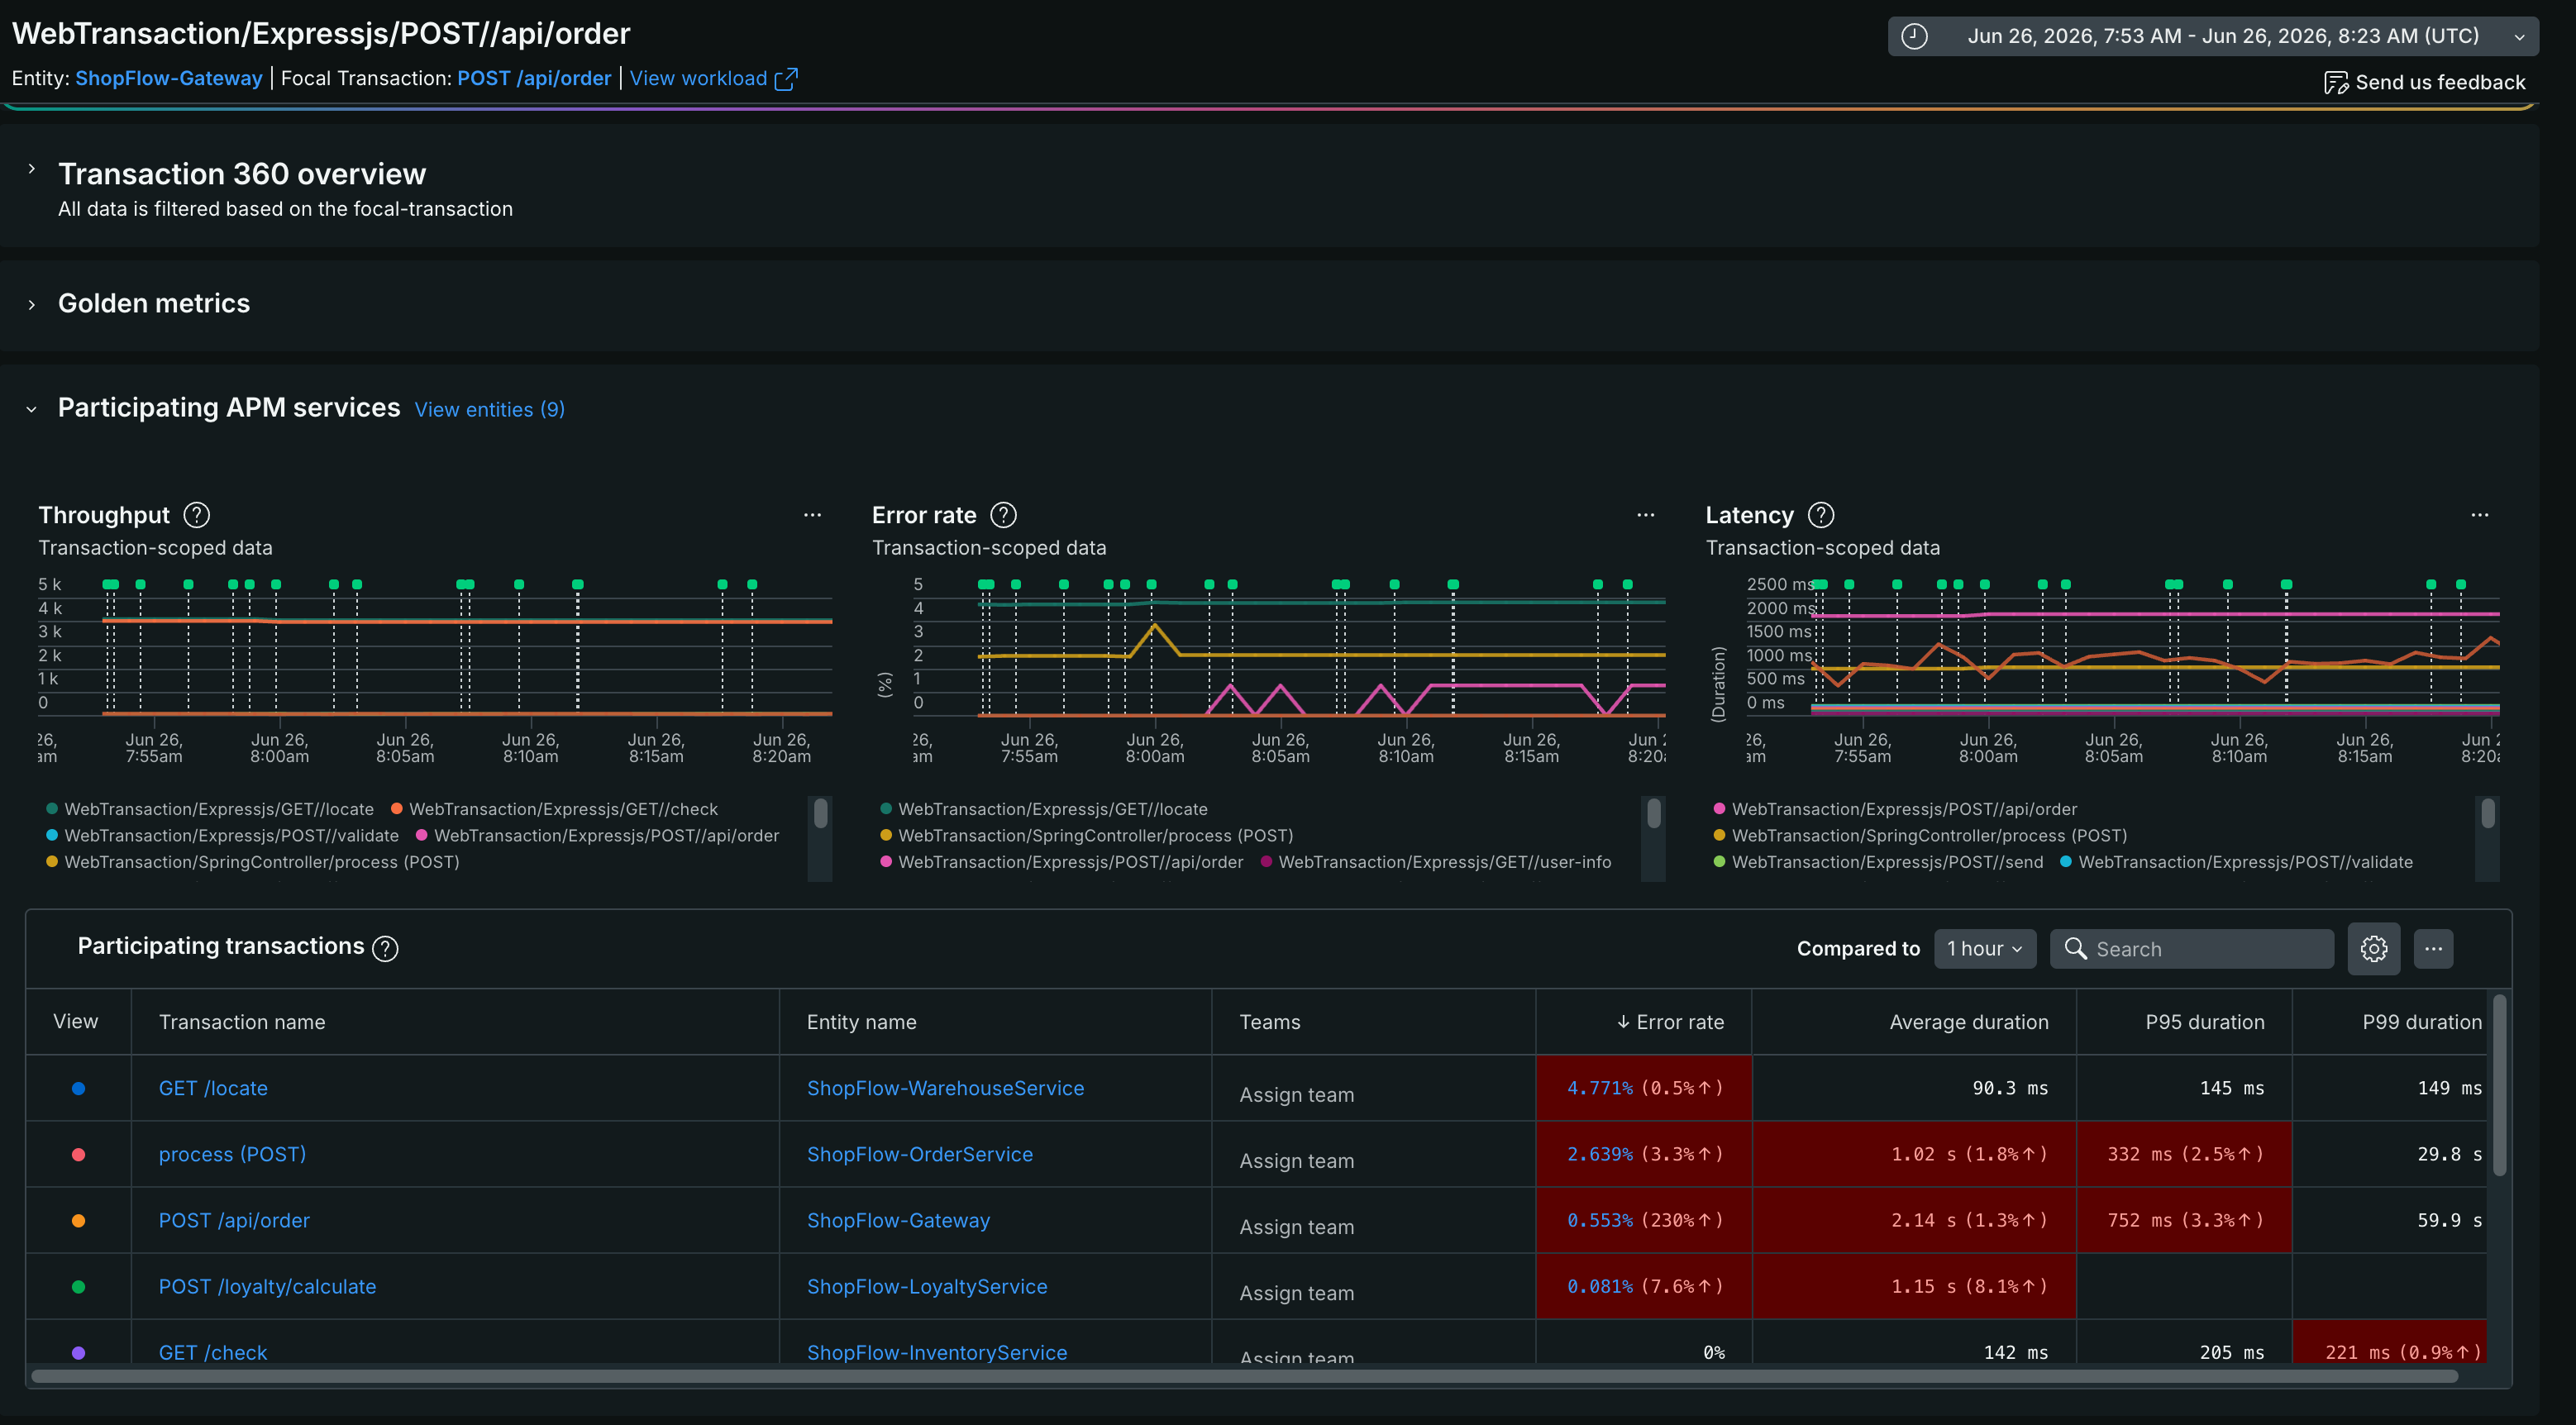
Lors du dépannage de transactions lentes ou d’erreurs, utilisez Transaction 360 pour voir exactement quels appels de service sont lents ou défaillants.
KPI
Accédez à votre catalogue complet de métriques métier personnalisées. Bien que la page Résumé affiche jusqu’à trois tuiles de KPI clés, cette page dédiée vous permet de visualiser des graphiques de séries chronologiques détaillés, d’effectuer des recherches dans tous les KPI configurés et de gérer les seuils d’alerte au niveau métier.
En savoir plus sur la création et la gestion des KPI →
Détails de l'entité
Affichez un inventaire complet de tous les services, bases de données, hôtes et fonctions serverless participant à vos workloads, ainsi que leurs états de santé et métadonnées. Pour en savoir plus sur les entités, consultez En savoir plus sur les entités.
Lorsque vous savez qu'il y a un problème mais que vous n'êtes pas sûr quel service en est la cause, examinez la page Détails de l'entité pour trouver les entités non saines.
Activité
Analysez une chronologie multiservice qui combine les métriques de performance, les variations de durée de transaction et les changements d'infrastructure en une seule vue. Utilisez les colonnes de variation comparative en % pour repérer instantanément les tendances de durée négatives ou les régressions du taux d’erreur sur l'ensemble des services suite à un déploiement.
La page Activité affiche :
- Débit: Volume de requêtes sur tous les services de charge de travail au fil du temps
- Taux d'erreur: Pourcentages d'erreur pour chaque service avec des lignes de tendance
- Latence: Temps de réponse montrant les variations de performance entre les services
- Transactions participantes: un tableau détaillé montrant les performances au niveau des transactions avec une analyse comparative des variations en %
Cartes
Visualisez les dépendances de service sur l'ensemble de vos workloads. Si vous remarquez des connexions manquantes ou des nœuds de service déconnectés sur votre carte, consultez Dépannage des workloads pour vérifier les exigences d'échantillonnage de traces et d'instrumentation de l'agent. Pour en savoir plus sur les cartes de services, consultez la documentation sur les cartes de services.
Événements et suivi
Suivi des changements
Corrélez les variations de performance avec les mises à jour de l’environnement à l’aide du suivi des changements. Cette vue fournit un log chronologique des déploiements récents, des basculements d’indicateurs de fonctionnalité et des mises à jour de configuration à travers toutes les entités du workload. Lorsque la latence augmente, vérifiez d’abord le suivi des changements pour voir si une sortie de code récente est corrélée à la baisse de performance. Pour en savoir plus sur le suivi des changements, consultez la documentation sur le suivi des changements.
Rapports
Niveaux de service
Suivez la conformité des services au fil du temps à l’aide des niveaux de service. Monitorez les SLI et les objectifs de niveau de service (SLO) définis, limités aux dépendances de votre workload, pour vous assurer que les transactions commerciales clés atteignent les cibles de conformité. Pour en savoir plus sur les niveaux de service, consultez la documentation sur les niveaux de service.
Paramètres
Personnalisez les calculs de santé des workloads et les métadonnées.
Configurer l'état de santé
Définissez des règles de cumul de l'état de santé pour vos workloads. Vous pouvez agréger les statuts d'alerte des entités individuelles à l'aide de règles du pire cas, de seuils de pourcentage ou de conditions NRQL personnalisées pour déterminer l'état de santé global du workload. Pour en savoir plus, consultez Configuration du statut du workload.
Paramètres généraux
Gérez les métadonnées du workload, modifiez les noms et les descriptions, ou supprimez le workload.
Important
La transaction principale sélectionnée lors de la création du workload ne peut pas être modifiée après la configuration. Pour monitorer une autre transaction, créez un nouveau workload.