Almost all applications and services make calls to APIs and other external services. When something as simple as pressing the buy button on a site can make dozens of API calls, issues are bound to arise. Problematic API calls can result in anything from a small inventory mishap to a code-red situation where your site can't communicate with your payment processor.
Analyzing these errors is time consuming. Is your site failing to process purchases because the purchase transaction call fails? Or maybe it's your authentication call to your payment processor? Maybe it isn't even an external API issue, but an issue with your internal inventory API. Is it even an API error or an error within your own applicaiton? With New Relic, you can solve these issues in a fraction of the time it would take manually.

Objectives
This tutorial series shows you how to identify problematic API interactions and how to resolve them with the New Relic platform. This doc covers:
- Integrating New Relic with your application to send data to monitor
- Identifying problematic APIs through the external services UI
Integrate New Relic
Before you can monitor or resolve anything, you need to install an agent to collect the data you'll use.
Install an APM agent
To monitor your application's performance, you'll use an agent created specifically for your app's language. Clicking a logo sends you to New Relic platform where you'll be guided through installing and configuring the agent.
Once you've installed an agent, go to one.newrelic.com and select your app. If you don't see much data just yet, step away for a while and let the agent gather real-time data as your application runs.
Additional setup
Your specific configuration may require additional setup. Take a look at our external service setup doc for more information.
Once you've completed any additional steps from the doc above, go to one.newrelic.com > select your app > External services. You should see data about your APIs and external services flow in.
Identify problematic APIs
You now have the ability to track how your application interacts with APIs and other external services. Let's use that info to identify which APIs or external services are causing issues:
Think about the root cause
If you're looking for problematic APIs or services, you probably already have an issue you're ready to solve. Maybe your users can't make purchases or even log in to your site.
Your application might make calls to dozens or hundred of APIs. While you continue with the following steps, keep your root issue in mind. If you know you have an issue with purchases you should focus on purchase and transacton related APIs. If it's a log in issue, you might focus on calls to user databases or external authentication services.
Triage with maps
Let's say you run an webstore and have received emails from your users complaining that they had not been notified when their package arrived. You find this strange as they should have received both SMS and email notifications.
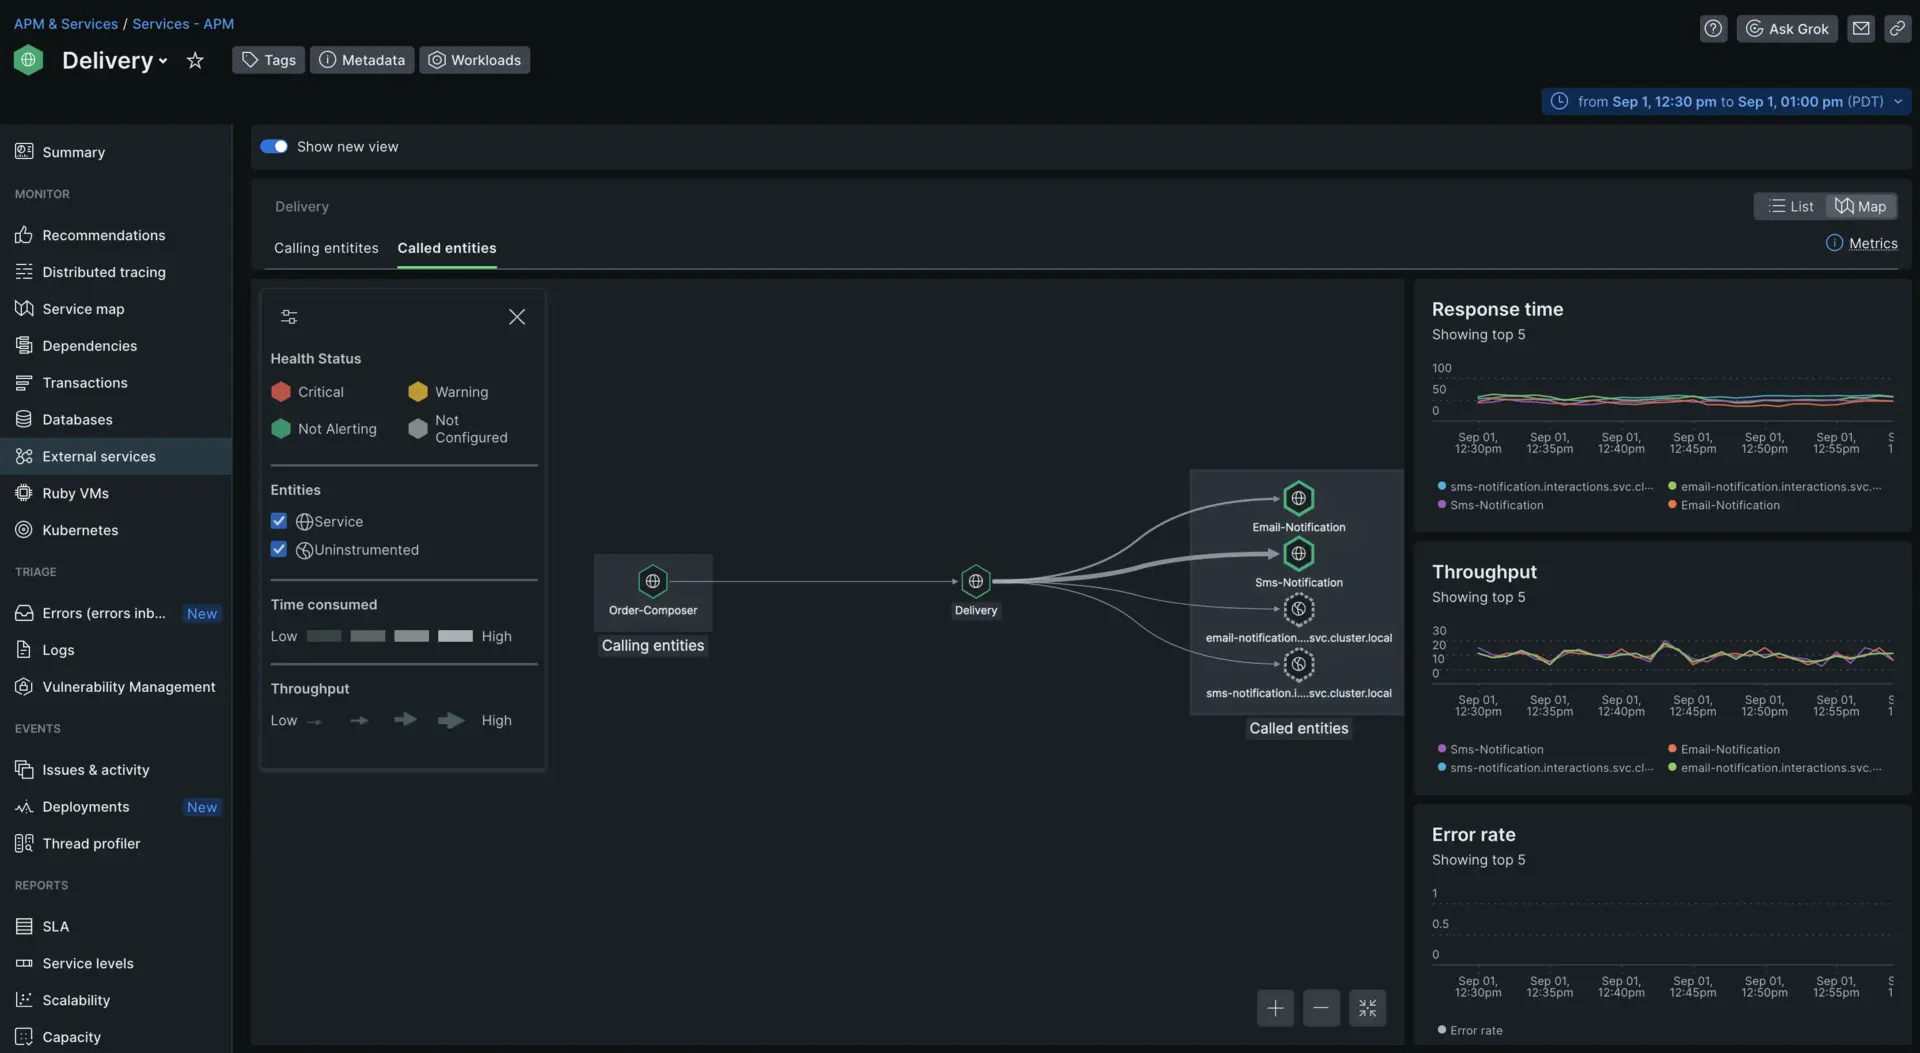
You've instrumented your service that handles the entire delivery process. Go to the External services page and then click Maps.

This shows you the relationship between all your own services and any external services or APIs. In this case, the service you care about triaging is Delivery. It is called by another service called Order-Composer and calls four other services and APIs as you can see to the right.
Identify anomalies
The map view shows you a few useful charts to track throughput and response time, but it also visually represents those metrics through the thickness and color of the line between your service and the services it calls.

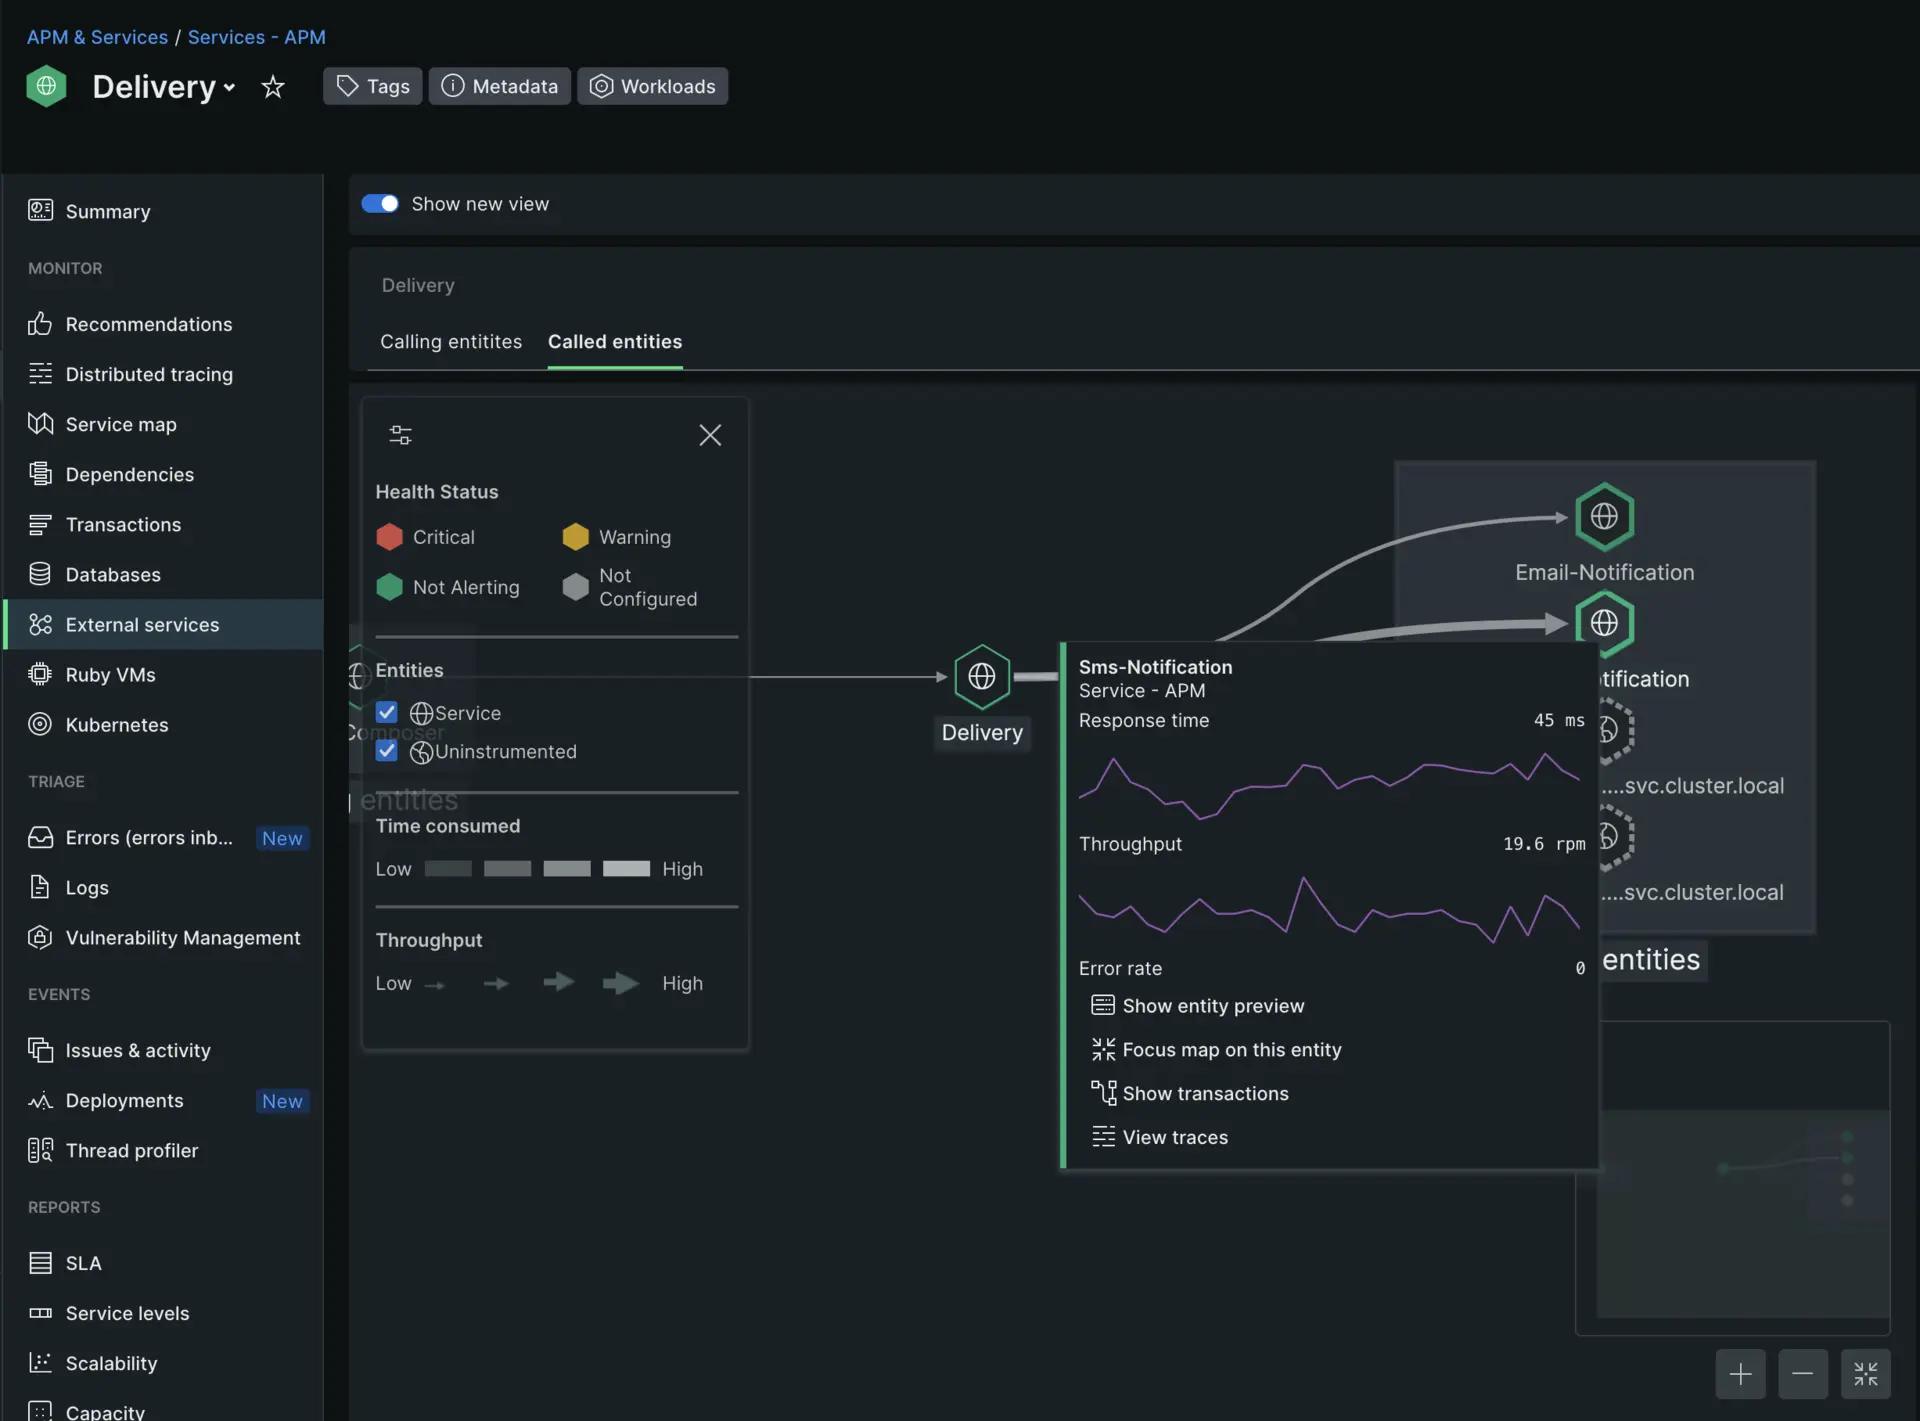
The lines between the Delivery service and it's dependencies all seem fairly similar except the one pointing to Sms notification. In fact, when you hover over the the SMS service you can see that the throughput is much higher than the rest of the dependencies.
You have now identified Sms notification as the likely cause of your users frustration. Now that we've identified a likely suspect, you can solve the root issue.