In part one of this tutorial, we chose an error group to investigate further. In part two, we'll investigate a new page that displays attributes, logs, and traces about the error.
This part of the tutorial guides you through two recommended avenues for analyzing an error, your logs and stack traces.
Objectives
This doc builds off the problem scoped from the Respond to service outages doc of this tutorial series. In this doc, you'll:
- Locate the error code associated with a failing API with logs
- Use stack traces to find where in your code the error is occurring
Locate the source of an error with logs and stack traces
The errors summary tells the story behind your error groups. Depending on how you've configured New Relic, each service might display different kinds of information about an error. For example, if you've disabled distributed tracing, you won't see as much detail about external services in your traces.
Find the failure point in your system
Depending on the nature of the log, you may have more or less logging detail to sort through. Because you spent time upfront narrowing down the service closest to the failure and choosing the likely error group, you have time to read your logs.

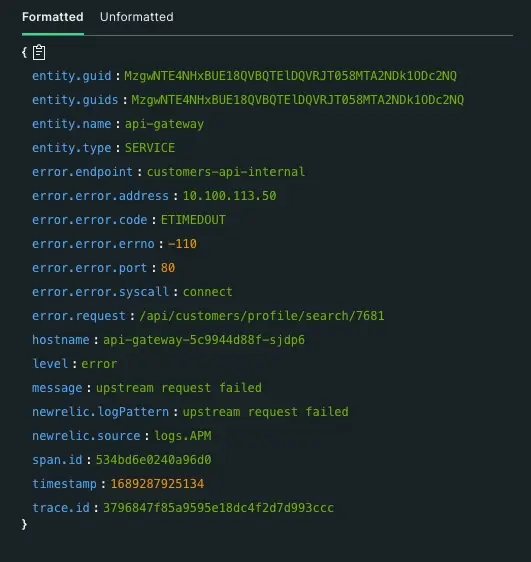
According to your logs, your problem is:
A timeout error:
error.error.code: ETIMEDOUTRelated to your customer API:
error.endpoint: customers-api-internalAgnostic to the kind of request sent to the customer API:
error.request: /api/customers/search/Kirlin/-/You have enough context to tie it together. You conclude that there's a dependency failure: All calls to the customer API are timing out and causing upstream requests from
api-gatewayto fail.
Find the failure point in your code with stack traces
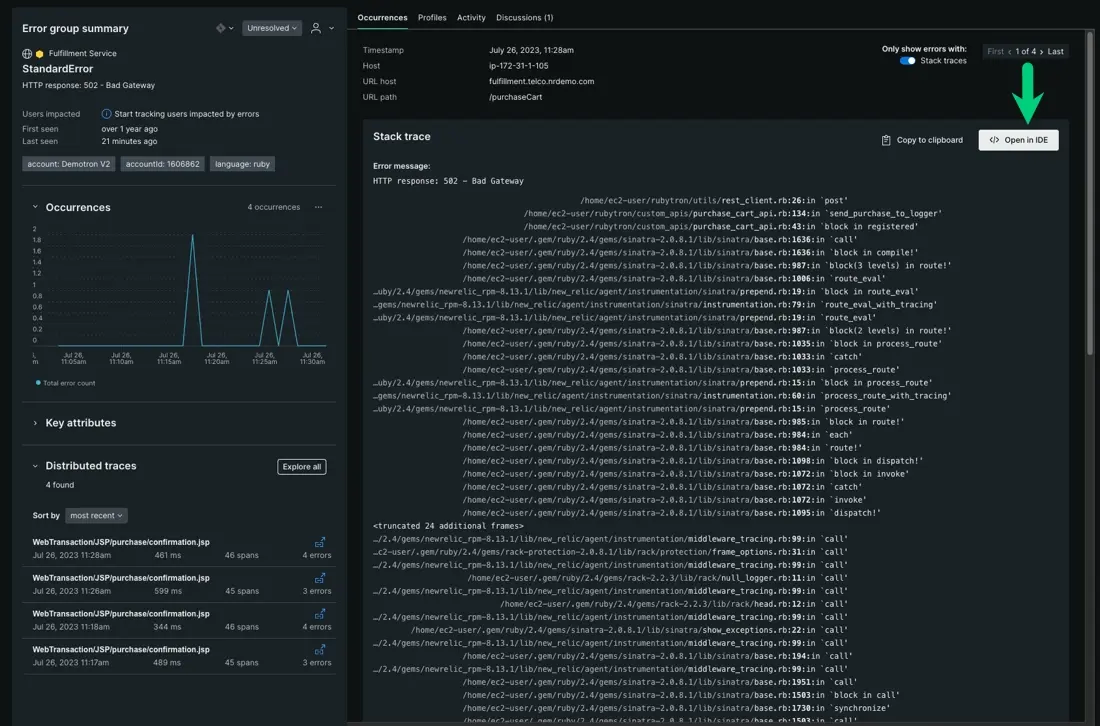
When you run your code, New Relic captures your exceptions or runtime errors and organizes them into a waterfall view. These are your stack traces. Depending on the language used, these stack traces provide detailed messages and the locations of your failure points.

While your logs tells you what's causing the error, your stack traces identify the where. You can use these stack traces to find exactly where in your code an error is occurring, then connect those errors to the owning team.
Open in your IDE from New Relic
To open your code from New Relic, you need to install CodeStream. This is an optional but highly recommended feature that lets you open your IDE directly from stack traces:

What's next?
Reacting to an error and finding the direct cause of an outage is only part of dealing with errors in your app. Now that we've covered how to describe, diagnose, and find the source of an outage, you can route errors to the relevant teams.
