In the first NRQL tutorial, we explored the fundamentals of building queries. We covered basic query structure, defining time windows, and how to select specific attributes to observe. We also learned how to begin aggregating and display data using graphs and other visualizations.
In this tutorial, we'll go a little deeper and explore more functions for creating useful aggregations. Here, you'll learn how to compare returned data with previous time periods and group data into specific time windows. You'll also find even more things to do with SINCE and UNTIL functionality, and explore using wildcards in filters. Specifically, you'll learn how to:
- Query for unique values using
uniques(attributeName) - Determine how many unique values exist in an attribute using
uniqueCount(attributeName) - Retrieve the
earliest(attributeName)andlatest(attributeName)within a specific time window - Calculate percentages based on a qualifer or other data point with
percentile() - Perform basic math using attributes and aggregation functions, or a combination of both
- Cast attribute names to something custom and more readable
- Search to include/exclude using wildcards with
LIKEorNOT LIKE, or limit results to thoseINa list orNOT INthat list - Query within more advanced time windows using dates, epoch, and
WITH TIMEZONE - Group data into interesting time windows using time-based cohorting
Let's get started!
Aggregate functions
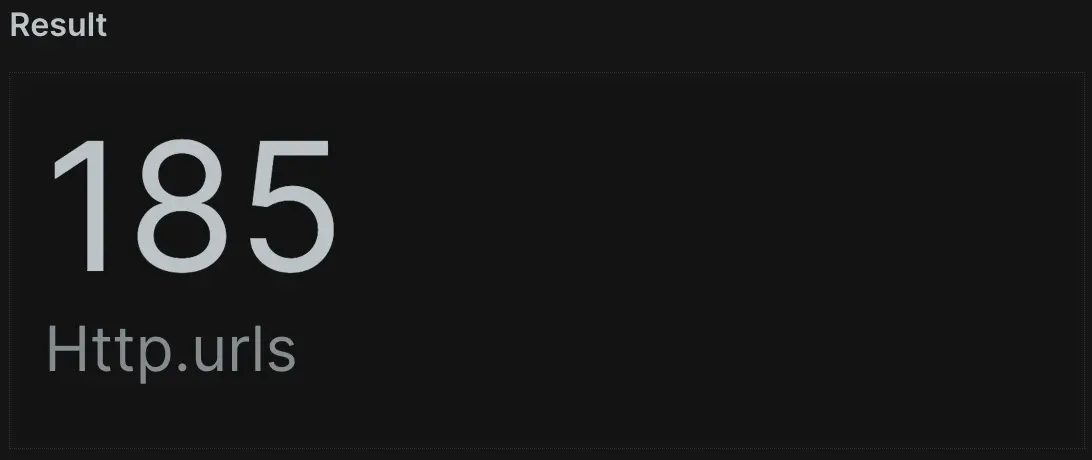
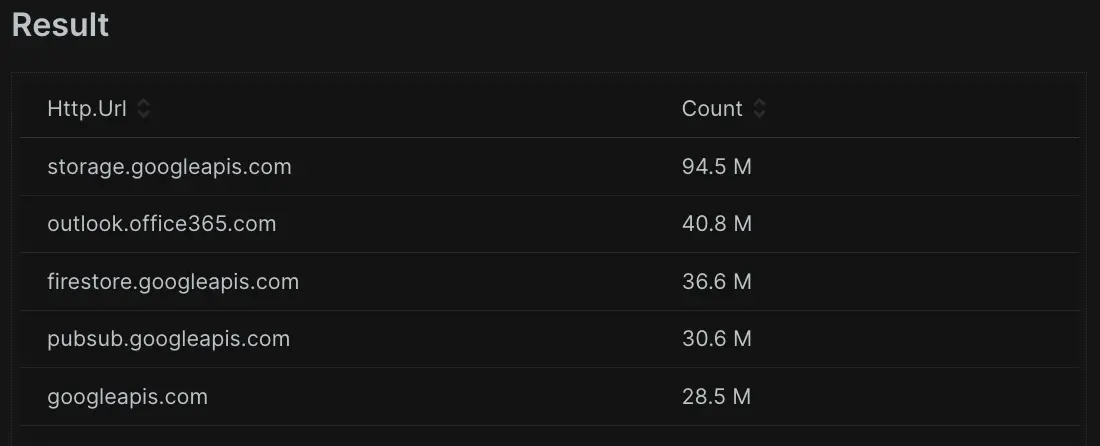
After completing the first first NRQL tutorial, you've used count(), average(), sum(), max() and min() to transform your data in meaningful ways. But what if you want to find and count unique values? To find the number of unique values recorded for an attribute over a specified time range, you can use the uniqueCount() function. You only need to provide the attribute we want to inspect as an argument. For instance, here is a query to display all the unique public API calls:
To optimize query performance, the function above returns approximate results for queries that inspect more than 256 unique values. To return the actual list of unique values for an attribute over a specified time range, we can use the uniques() function.
SELECT uniques(http.url) FROM Public_APICall SINCE 1 day agoIf you want to provide a second limit parameter to specify a different limit value from the default of 1,000. You can do this using uniques(attribute[,limit]), which will modify the limit to whatever you want it to be up to a maximum of 10,000.
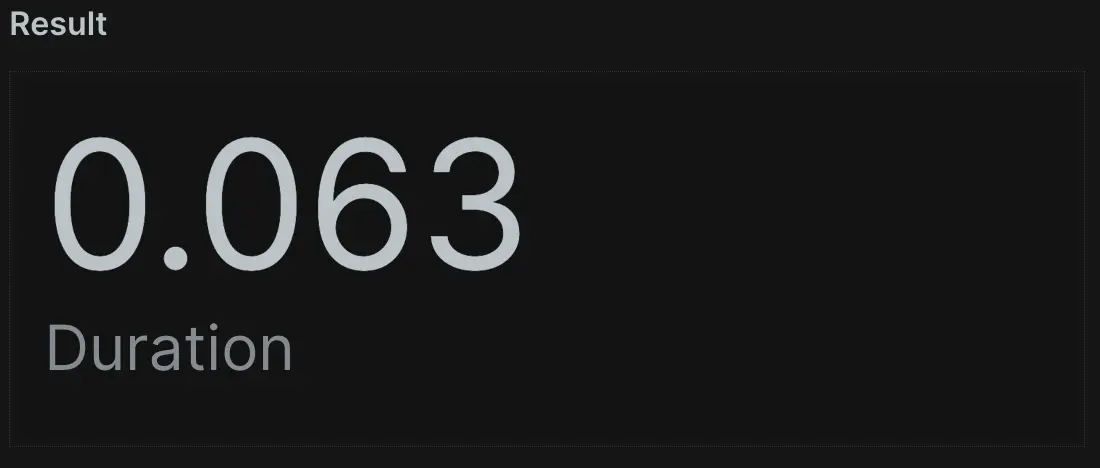
To retrieve the most recent value of an attribute over a specified time range, use the latest() function. In this sample query, you could locate the most recent response time for an API call in the last day. This could help you locate the latest value for an intermittently reporting transaction or service.
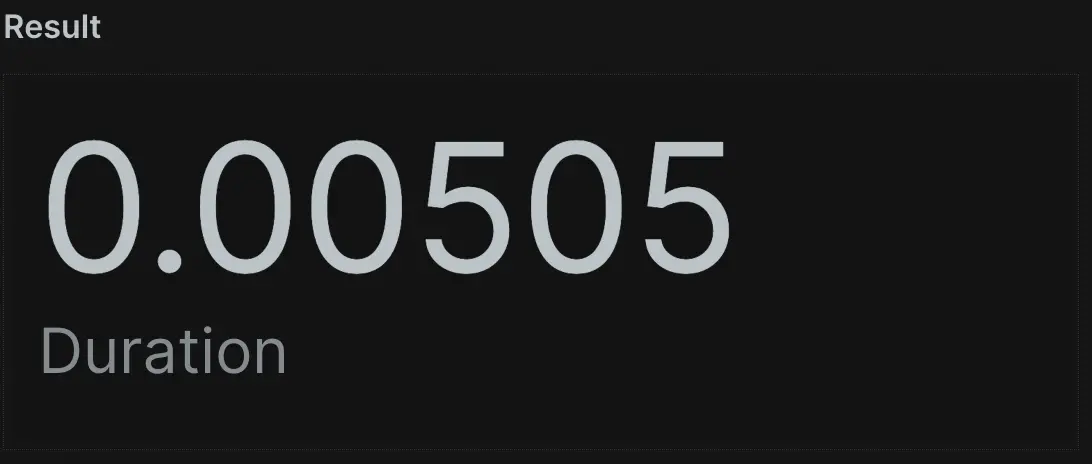
On the other side of the spectrum, you could use the earliest() function to achieve the opposite. It will return the earliest value of an attribute recorded in the specified time range. In this sample query, you can retrieve the earliest response time for an API call in the last day. If data is consistently reporting, this will report the data point from the earliest event in the last 24 hours.
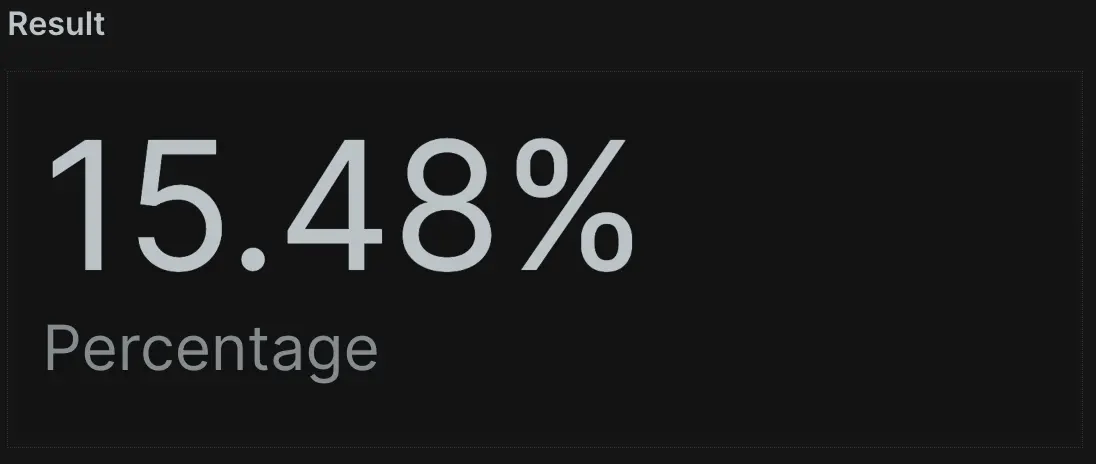
You may find that you need percentages instead of counts, sums, or averages. Using the percentage() function allows you to calculate the percentage of a value in the data set that matches a specified condition. This function takes two arguments: the first is an aggregator function for your desired attribute, such as count(). The second is a WHERE condition to specify the subset of data you'd like to query.
In this sample query, you can find the percentage of API calls over the last day that had a duration (or response time) greater than 100 milliseconds.
It's very common to view application performance or customer experience data using percentiles rather than averages. You can use the percentile() function to understand the experience of the nth percentile.
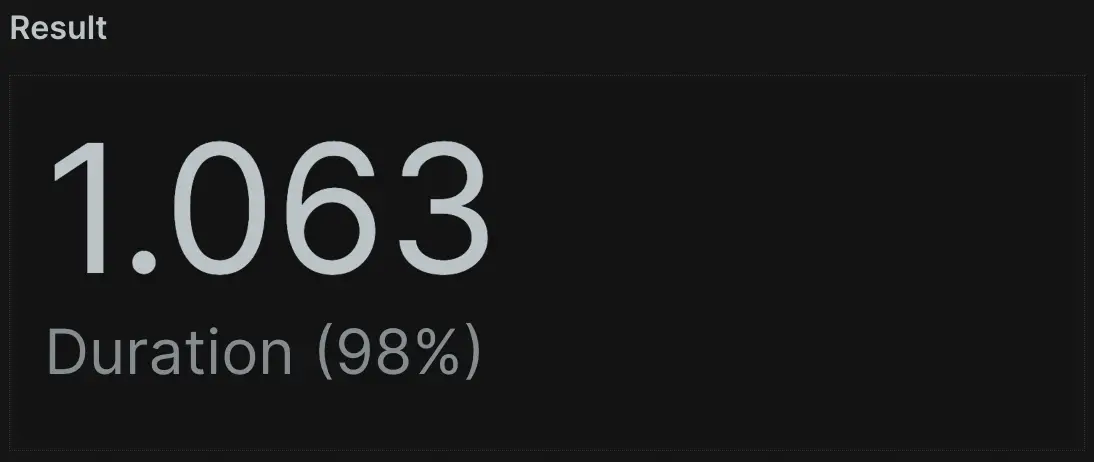
For example, let's say you want to know what the worst experience (highest duration) of 98% of your customer experience over the past day. You can ask NRDB for percentile(duration, 98) from the last 24 hours.
As you can see, aggregation can manipulate data in powerful ways. You can use uniqueCount() to count the unique entries of a particular attribute. But you could also use this to identify a count of unique machines, reporting containers, or even how many custom data points get sent to New Relic. And, if you want to know what unique values are available to query, you can always ask for a list using uniques().
The latest() and earliest() functions have particular value when dealing with sparse data, or investigating when something began or stopped reporting (assuming New Relic still stores the data). The percentage() function can show you what percentage of events matched a qualifier compared with the overall result set. Lastly, you can use percentile() as a Key Performance Indictator by setting a goal to ensure 90% of all end user transactions exceed the provided duration.
In the next step, you'll learn how to do basic mathematics with NRQL.
Use math operators
NRQL supports basic math operators. You can perform addition (+), subtraction (-), multiplication (*), and division (/) on both numeric attribute values, and results of aggregator functions.
For example, we capture both the total response time (as duration) and database response time (as databaseDuration)when we record a transaction event. But what if you want to find the average time spent outside of database processing? You could start by calcuating that value for each event in your data set using a query such as this one.
SELECT GigabytesIngestedBillable - GigabytesIngestedFree, metric FROM NrMTDConsumption WHERE productLine IS NOT NULLGreat! You just performed some basic math. This is useful to help you list individual events. But what if you want to know the average duration of transactions without the database time? Conveniently, you can do the arithmetic within the function:
SELECT average(GigabytesIngestedBillable - GigabytesIngestedFree) FROM NrMTDConsumption WHERE GigabytesIngestedBillable IS NOT NULLNow, what if you wanted to get even more complicated by subtracting, dividing, and multiplying in the same query to figure out the duration without database time, as a percentage of overall time? Well, you can add the math:
SELECT average(GigabytesIngestedBillable - GigabytesIngestedFree) / unitPrice * 100 FROM NrMTDConsumption WHERE GigabytesIngestedBillable IS NOT NULLNew Relic reports timings as part of your events, so you can use them to calculate meaningful data points or even generate percentage results. You can further maximize the power of basic mathematics by doing things like timing custom actions or events, or sending custom data. For instance, an e-commerce platform that reports data about order sizes and payment methods could use math to calculate things like the conversion rate of orders vs. unique customer visits.
In the next step, you'll learn how to use NRQL to label your attributes.
Label attributes
As you start performing more complex NRQL functions, you may wonder if you can make the names displayed for query attributes more helpful, especially for others that don't know NRQL! Let's consider an example using what you learned in the previous tutorial.
SELECT average(duration-externalDuration) FROM TransactionYou can use the AS clause after a function or attribute to give the result a more readable, meaningful name. This makes it easier for you and your team to understand exactly what a chart represents.
SELECT average(duration-externalDuration) AS 'Non-External Response Time' FROM TransactionThis may seem merely aesthetic, but when you build detailed dashboards, it's important to clearly label your data. This ensures zero ambiguity for anyone viewing your widgets, billboards, line charts or tables.
We'll refer back to this in an upcoming lesson about grouping, to explore how AS can create clean result sets in more advanced scenarios too. Next, you'll learn how to compare data in different windows of time.
Compare time windows
By now, you have practice using time ranges with SINCE and UNTIL clauses. But what if you want to compare values from different time ranges? You can achieve this with the COMPARE WITH clause.
NRQL uses SINCE and UNTIL to define a period of interest. Then, you can denote the time period you want to compare against by using a COMPARE WITH [time period] AGO clause containing a relative offset value.
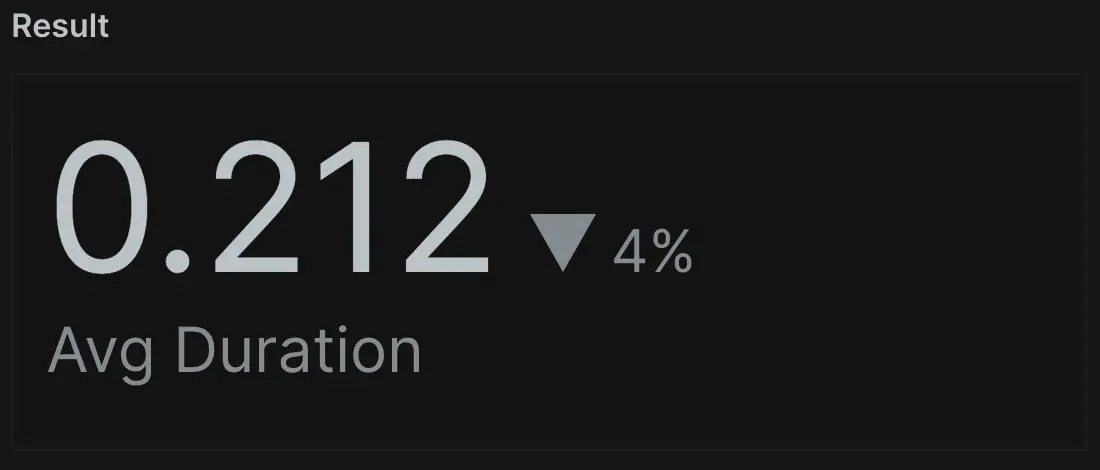
For example, in the sample query below, you can compare data from the last day against data from the previous week using a relative offset of 1 week ago.
Comparisons can quickly answer questions about what's happening in your applications. Are different sales, performance, MTTR, or error values up or down compared to last week? And, if you're investigating an issue, you'll find it useful to compare a period of problemantic performance to a period of normal performance.
Use wildcard filters
You now know how to use a WHERE clause to filter the results in our query. Aside from using standard comparison operators, you can also use LIKE and NOT LIKE if you want to find whether an attribute does or doesn't contain a specified substring. To achieve this, you can use the percent (%) symbol as a wildcard anywhere in the string.
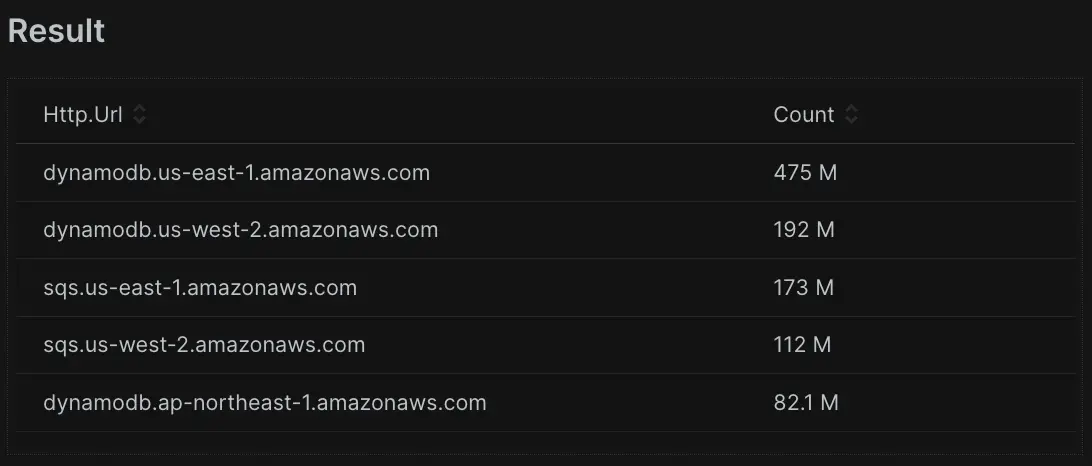
In our sample query, you can get the number of transactions with the term "amazonaws" anywhere (beginning, middle or end) in the name.
You can use % as a wild card at the beginning and end, which means that New Relic checks the value of the attribute you chose if it contains the term, such as "Web" anywhere in the text. Equally, you could use %Web OR Web% to match something that ends in "Web" or starts with "Web", respectively.
You can also add the wildcard in between strings for a more refined search. This query checks for a transaction name that contains the word "amazon" followed by any text, but then also contains the term ".com" followed by any number of characters. So, the results will only be transactions with "amazon" and ".com" in the name.
What if you need extreme specificity and the names don't have a common string you can match using wildcards? The IN and NOT IN operators allow you to specify a set of values that you'd like to check against an attribute. Instead of specifying multiple WHERE clauses with AND or OR operators, you can simplify a condition by listing the values in parentheses separated by commas.
In this sample query, you can count the number of transactions whose subtype is either "graph.microsoft.com" or "s3.amazonaws.com". If you change the query to use NOT IN instead, then you'd get the number of transactions whose subtype is neither "graph.microsoft.com" nor "s3.amazonaws.com".
You can now control your data and manipulate it to do what you need, allowing you to construct powerful, meaningful dashboards and alerts. Next, you'll learn how to specific time ranges using NRQL.
Specify time ranges
The SINCE and UNTIL clauses do more than give you information on relative time ranges: you can also provide them with a specific date or time. In the following sample query, you can use a SINCE date in YYYY-MM-DD format.
SELECT average(duration) FROM Public_APICall SINCE '2023-10-28' TIMESERIES MAX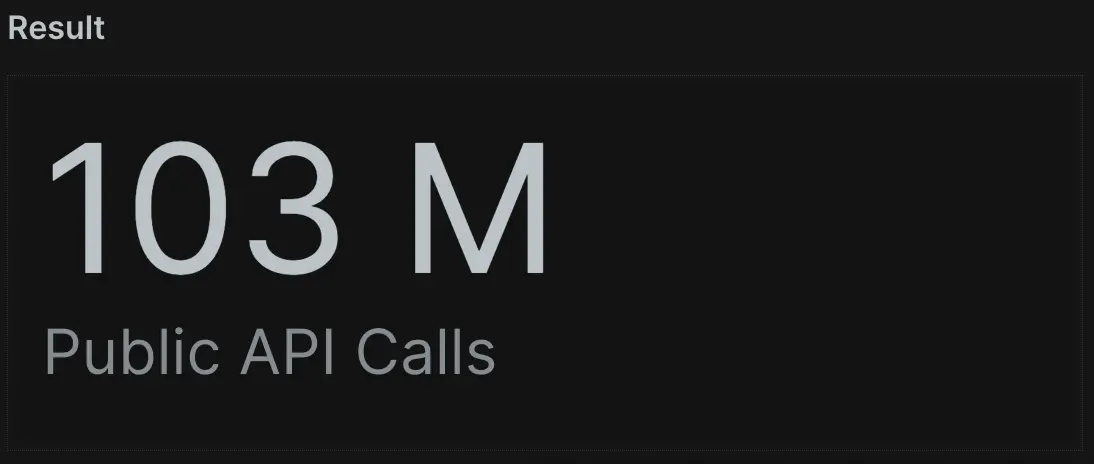
You can use this for creating SLA reports for a specified period of time. You can even include a specific time with the format YYYY-MM-DD HH:MM. In this query, you can see the data is set at 6pm.
SELECT average(duration) FROM Public_APICall SINCE '2023-10-28 18:00' TIMESERIES MAX
Sometimes you might receive an event time in epoch (unix) time. Conveniently, you can use epoch timestamps with SINCE and UNTIL clauses so you don't have to manually translate these values into another date format.
SELECT average(duration) FROM Public_APICall SINCE 1698525489519 UNTIL 1698698289519 TIMESERIES MAX
When NRDB shows data over a period of time, it assumes you want to see the data from the perspective of your timezone. But with dispersed international teams, your today could be a teammate's tomorrow or yesterday, depending on their location. You can use the WITH TIMEZONE clause to define a timezone to display data from. This affects the interpretation of values in SINCE and UNTIL clauses.
Consider the two example charts below. Each query has a specified timezone using WITH TIMEZONE. The two are 8 hours apart. Notice the pattern of data is the same, but offset 8 hours to align with each respective timezone:
SELECT count(*) FROM Public_APICall SINCE yesterday UNTIL today WITH TIMEZONE 'America/Los_Angeles' TIMESERIES
SELECT count(*) FROM Public_APICall SINCE yesterday UNTIL today WITH TIMEZONE 'Europe/London' TIMESERIES
Before this lesson, all your time control mechanisms depended on relative times from now. Now, you can adjust the view depending someone's location in the world. Maybe a customer in east coast America reports an issue to your engineering team located on the west coast. Your team can build a dashboard and translate the view to map to the timezone as a customer would cite. So, if a customer advises an issue at 9am on the east coast, you can ensure when you look at 9am that you don't have to mentally translate the difference.
When you need to focus your data to specific dates of an alert event and you want to investigate the data without a moving time window relative to the current time, this will help you obtain data in a static time window. In the next and final lesson, you'll continue learning how to use time in your reporting with time-based cohorting.
Using time-based cohorting
While it may sound complex, time-based cohorting merely means a way to organize data into time-based groups like minuteOf, hourOf, weekOf, and more.
When you use the SINCE clause for durations, you retrieve the entire length of time queried for. But that data may not always tell the whole story! What if you need to ananlyze performance within a period of time more closely? With time-based cohorting, you can further sort the data into logical, time-based groupings.
Using a combination of FACET and one of the many time-based functions (such as hourOf(timestamp)), you can take a week's worth of data and understand performance based on the specific hour it occurred. This reveals trends and identifies the most critical times for your applications:
SELECT average(duration) FROM Public_APICall FACET hourOf(timestamp) SINCE 1 week ago
After running the query above, you can see the slowest response time based on the hour of the day. New Relic provides many different options to facet based on time. The previous example groupes by the hour, but you can also group by the day of the week to determine which days have the best and worst response times.
SELECT average(duration) FROM Public_APICall FACET weekdayOf(timestamp) SINCE 1 week ago
Now you can see the slowest periods of your applications on any specific day. You could use this to answer business-critical questions like "When do we sell the most products?", or "When do we have the most sign-ups or logins?".
You can also group results by a specific date. This helps when considering SLA reports, or analyzing performance changes over a given period.
SELECT average(duration) FROM Public_APICall FACET dateOf(timestamp) SINCE 1 week ago
Time-based cohorting exposes problems that occur on specific minutes, hours, days, or weeks. No matter what data you send to New Relic, NRQL allows you to slice, dice, organize, and visualize it however you want.
There are also many other options available to group by, including week, month, and year depending on your data retention. To see the full list, head to our Group Results Across Time documentation Page.
What's next?
With the knowledge you've gained here, you can create dashboard visualizations and control the aspects of your data you're most interested in. You can use these powerful techniques for narrowing focus for more granular, specific alerts and produce much more interesting visualizations. When you're ready, you can advance to our third tutorial, where you'll learn more interesting NRQL skills including filters, facet cases, histogram, apdex, filtering to eventTypes, overriding values, and extrapolation.
