preview
We're still working on this feature, but we'd love for you to try it out!
This feature is currently provided as part of a preview program pursuant to our pre-release policies.
Dimensional metrics are an industry standard for storing and querying metric data. New Relic stores all infrastructure metrics as event data, but you can also query them as dimensional metrics.
At New Relic, we report metrics in several ways, including dimensional metrics, which our metric API, Telemetry SDK, some open-source integrations, and our infrastructure services can all use.
This type of metric enables you to:
- Enjoy an improved query experience for infrastructure data.
- Discover all your metrics in one place.
- Use more metric sources, such as Prometheus.
For example, you can use the following queries to get the maximum duration of your Lambda functions:
Query with samples | |
Query with metrics | |
Get started
You don't need any agent or integration updates to use these metrics. We support NRQL alerting based on dimensional metrics, except for data coming from cloud integrations (such as metrics from AWS polling integrations, GCP, and Azure). New Relic ingests AWS CloudWatch Metric Streams metrics as dimensional metrics, and we recommend you use NRQL in these cases.
Where and how to query dimensional metrics
New Relic supports all current NRQL query features. You can use WHERE, FACET, and time selection functions such as SINCE, UNTIL, and COMPARE WITH for querying.
Naming conventions for metrics and attributes
All metric names and attributes for dimensional metrics follow the same naming convention to make them easy to find and use. Metric and attribute names are namespaced with dots: for example, the host. prefix is used for host metrics, the k8s. prefix is used for Kubernetes metrics, and aws. is used for AWS metrics.
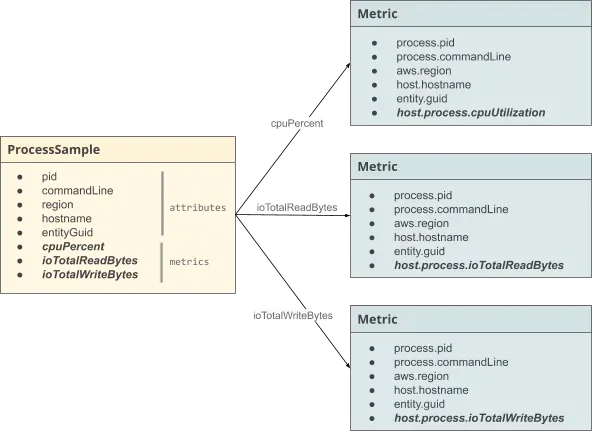
The graphic below shows how a ProcessSample that contains three metrics (cpuPercent, ioTotalReadBytes, and ioTotalWriteBytes) is split into three separate metrics. Note the updated naming of the metrics and the attributes.

Dimensional metrics naming convention
Differences in querying dimensional metrics and events
Dimensional metrics are a fundamentally different type of data compared to event data. Below, you'll find some notable differences when querying dimensional metrics:
Metric queries with
*do not return infrastructure sample data. For example:SELECT * FROM MetricMetric queries with
metricName LIKEdo not return infrastructure sample data. For example:SELECT uniques(metricName) FROM Metric where metricName like 'k8%'In order to select attributes starting with
tags.a metric name has to be provided. For example, this does not work without theWHEREclause:SELECT uniques(tags.environment) FROM Metric WHERE metricName='aws.lambda.function.duration'Results may not be complete if the selection criteria matches too many samples. For example, this query maps to all infrastructure samples, and may return incomplete results:
SELECT uniqueCount(entity.guid) FROM MetricWe don't support the newly introduced metric wildcarding feature, for example:
SELECT average(host.swap%Bytes) FROM MetricFunctions used on multiple metrics may fail or return incorrect results, for example:
FROM Metric SELECT latest(metricNameA + metricNameB)When you include
RAWin a query, the request transforms internally and prints equivalent, aggregated event data. It won't print raw data. Refer to the example query to see this behavior:SELECT max(host.cpuPercent) FROM Metric TIMESERIES 1 MINUTE SINCE 60 MINUTES AGO RAWWe don't support using
keysetwithTIMESERIES, and doing so will return an error. See the example below:FROM Metric SELECT keyset() WHERE instrumentation.provider = 'infrastructure' TIMESERIES
For an overview of data type differences, see New Relic data types.
Dimensional query examples
Here are some examples of NQRL queries with and without dimensional metrics: