TruEra fills a critical gap in your AI stack, explaining and testing model quality throughout the lifecycle. TruEra’s AI solutions explain, debug, and monitor machine learning models, leading to higher quality and trustworthiness, as well as faster deployment. The solution works across the model lifecycle, is independent of model development platforms, and embeds easily into your existing AI stack.
TruEra includes a model performance monitoring integration with New Relic to help MLOps teams correlate signals throughout the ML lifecycle and go beyond standard accuracy, and monitor input and output drifting.
Integrate TruEra with New Relic
Add a machine learning model to TruEra
TruEra provides a command line interface (CLI) and Python client to ingest the machine learning model and other data. Steps to add a model using the CLI include creating a new project, data collection, adding training data, packaging and ingesting the model, and adding production data.
These steps can be found on the TruEra technical documentation page.
Stream data from TruEra to New Relic
Whenever a new set of data is ingested into the Truera Monitoring system, it computes relevant metrics and stores it. These computed metrics can be periodically pushed to New Relic using the truera2newrelic data exporter. This exporter needs API keys generated by the Truera and New Relic consoles.
The following instructions will show you how to create these keys:
- Login into your New Relic account: Go to one.newrelic.com > All capabilities > + Add more data.
- Click on TruEra: In the search bar, type TruEra.
- Select an account ID: Select the account ID you want TruEra to integrate with.
- Select or create an API key: You need an Active dashboard key for dashboards management, and a Model metrics data key for metrics ingestion. These keys refer to the . Create a new key, or select an existing one under the two key sections.
- Create a key on TruEra: Log into the TruEra console, and go to the users page. Click on Generate Credentials to create an Auth token.
- Verify the data export run and set up the batch exporter: Now go to TruEra docs to find steps on how to verify the first data export run using commands in your terminal. Next, set up the batch data exporter on a virtual machine.
Did this doc help with your installation?
View out-of-the-box New Relic dashboards using TruEra
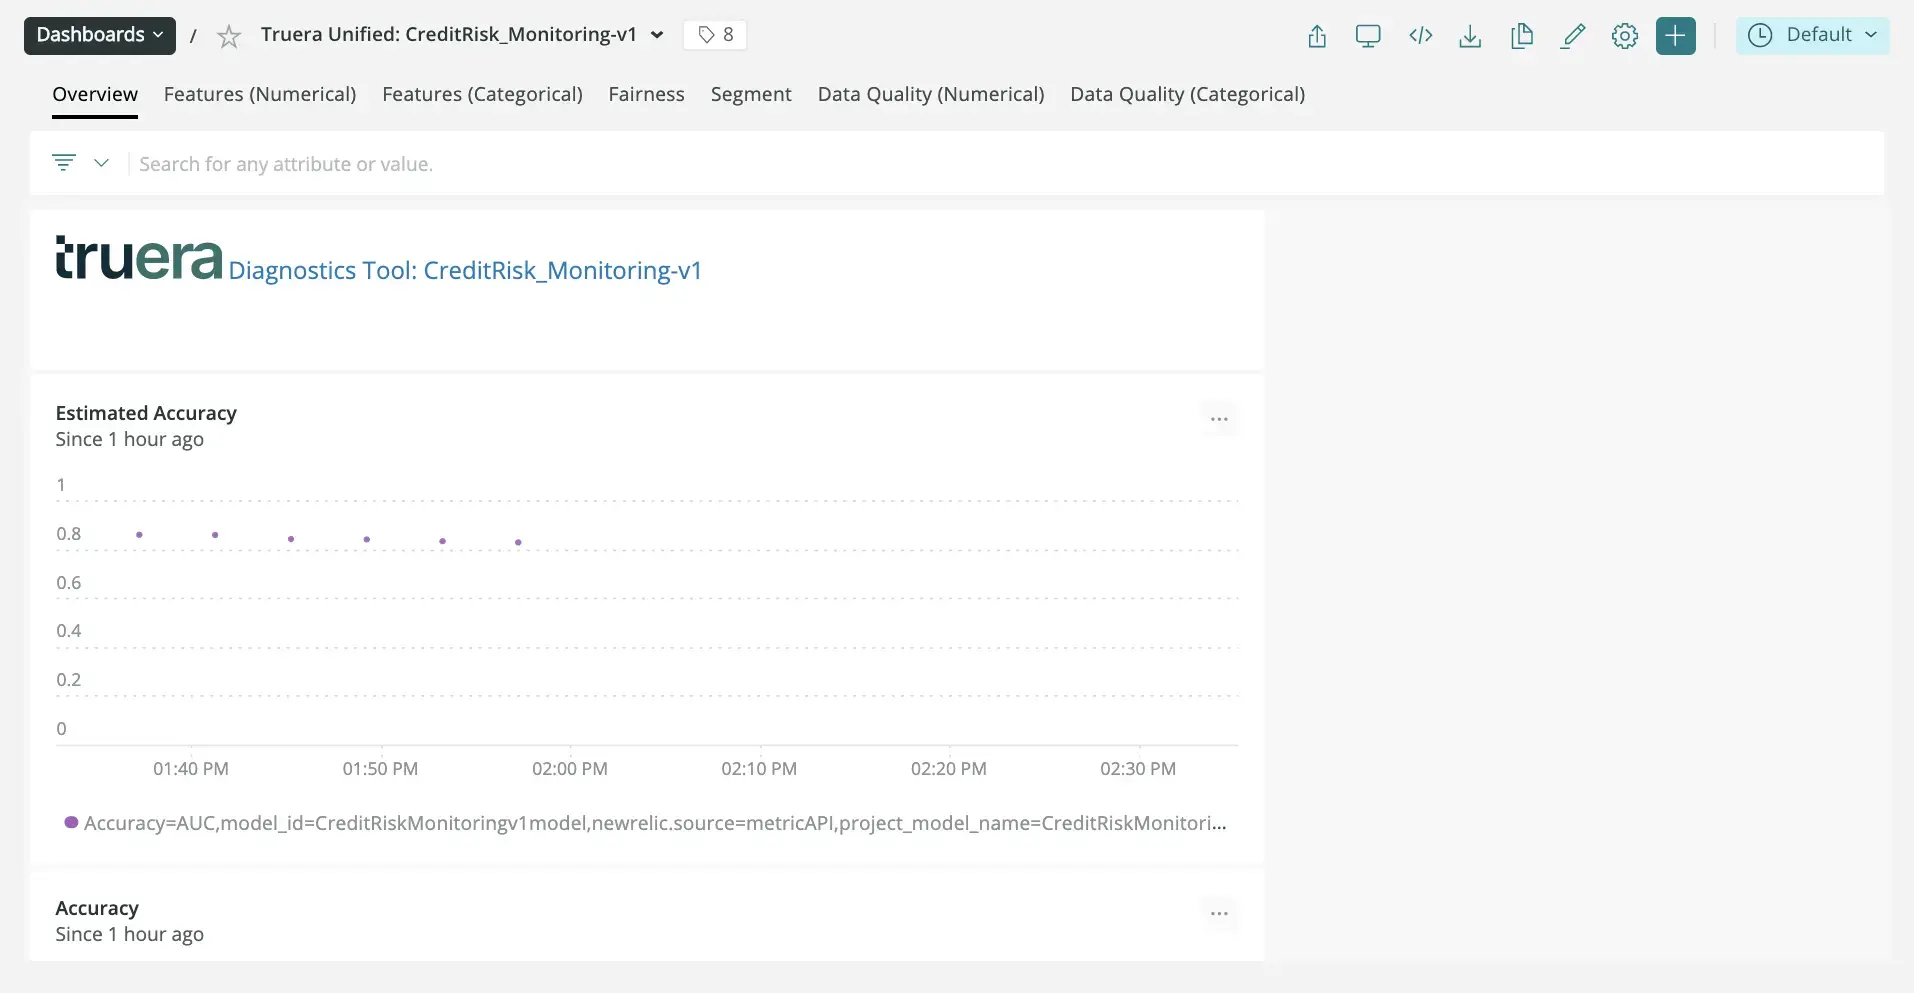
To visualize machine learning monitoring metrics, TruEra provides skeleton dashboards to monitor and drill down on issues using themes like model health, segment drilldown, feature values, data quality, fairness, and more.
These can be set up using the truera2newrelic dashboard tool. To do so, follow these steps:
Verify your model metrics: From one.newrelic.com, go to the navigation menu and click on the dashboard tab on the main navigation menu. You will see an automatically generated dashboard setup for the given ML model. Verify that recently exported model metrics are visible.

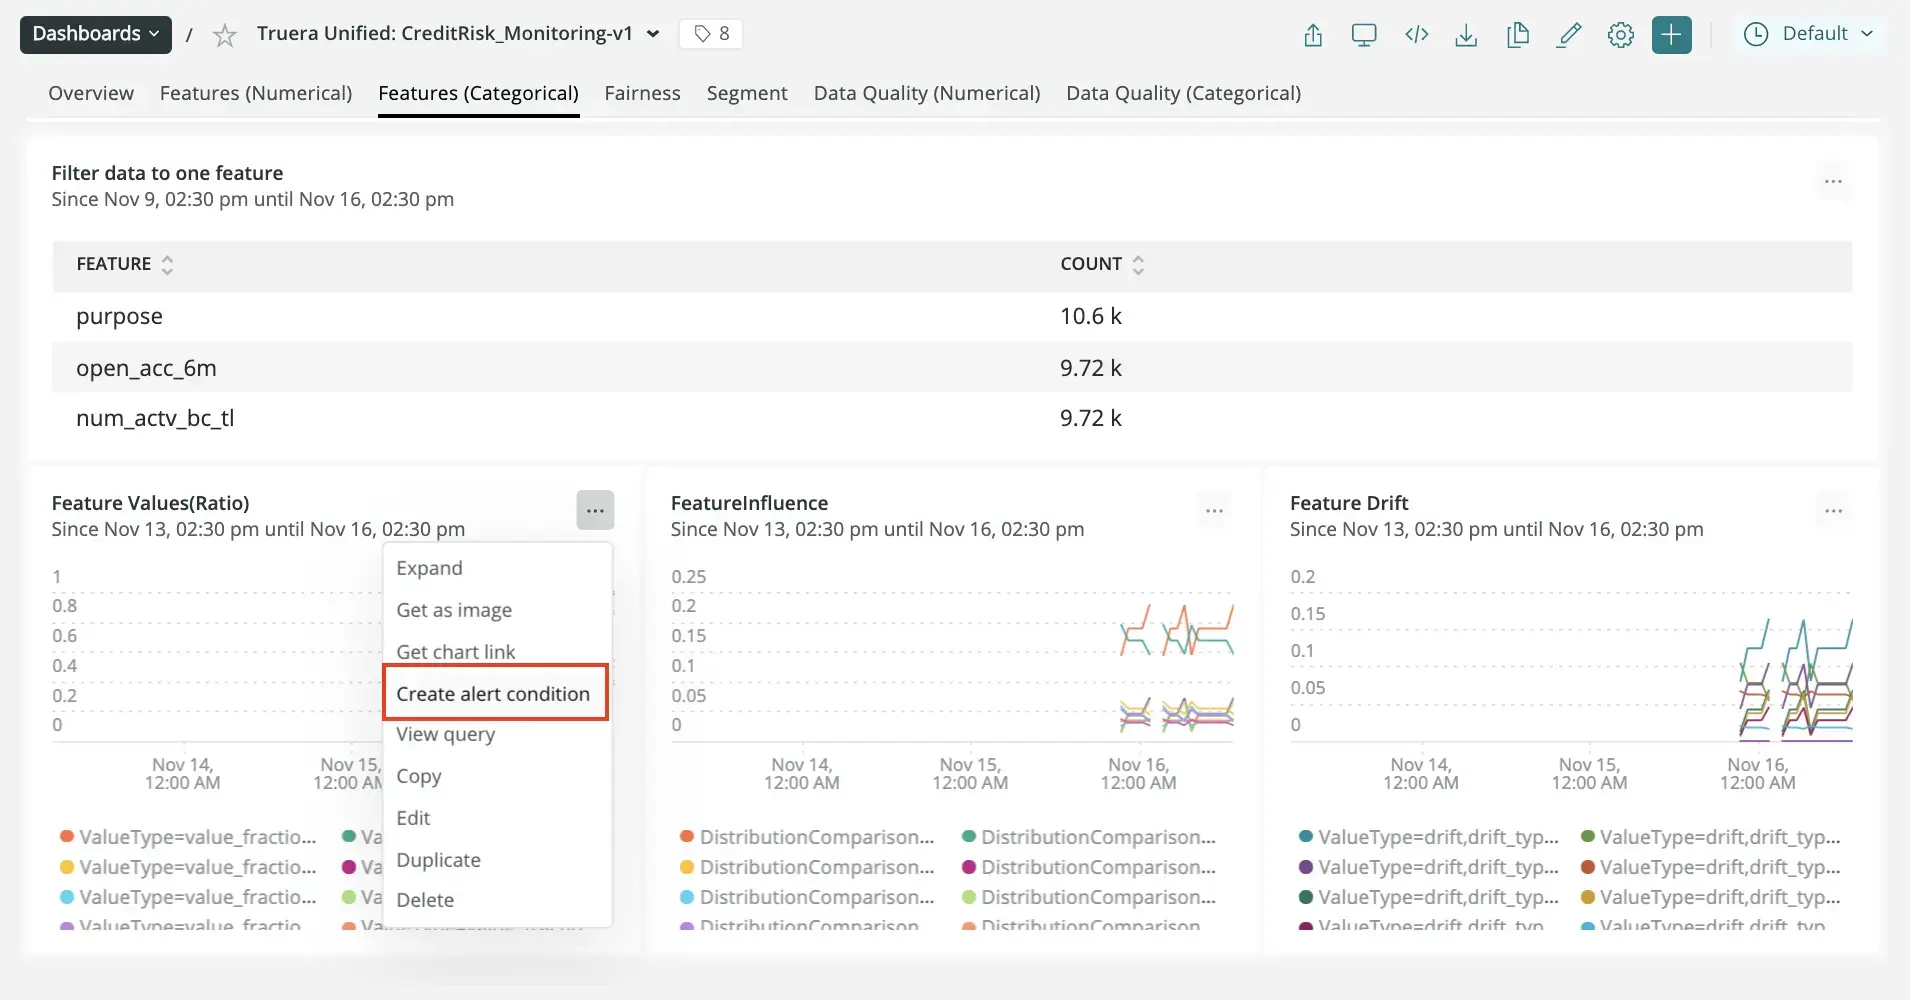
Set up alert notifications: Once you've created some dashboards, you can get alerted on your data. To create a NRQL condition from a chart, click the chart widget, then click Create alert condition. Once you've named and customized your condition, you can add it to an existing policy or create a new one.

Get notified: Once you've created an alerts condition, you can choose how you want to be notified. See our docs on how to set up notification channels.
Correlate your incidents: In addition to notifications, you can use incident intelligence to correlate your incidents. See our docs on how to correlate incidents using decisions.
You’ve now successfully integrated New Relic with TruEra. Newly created alerts are now correlated with your New Relic alerts, and you should be able to see data about newly reported predictions.