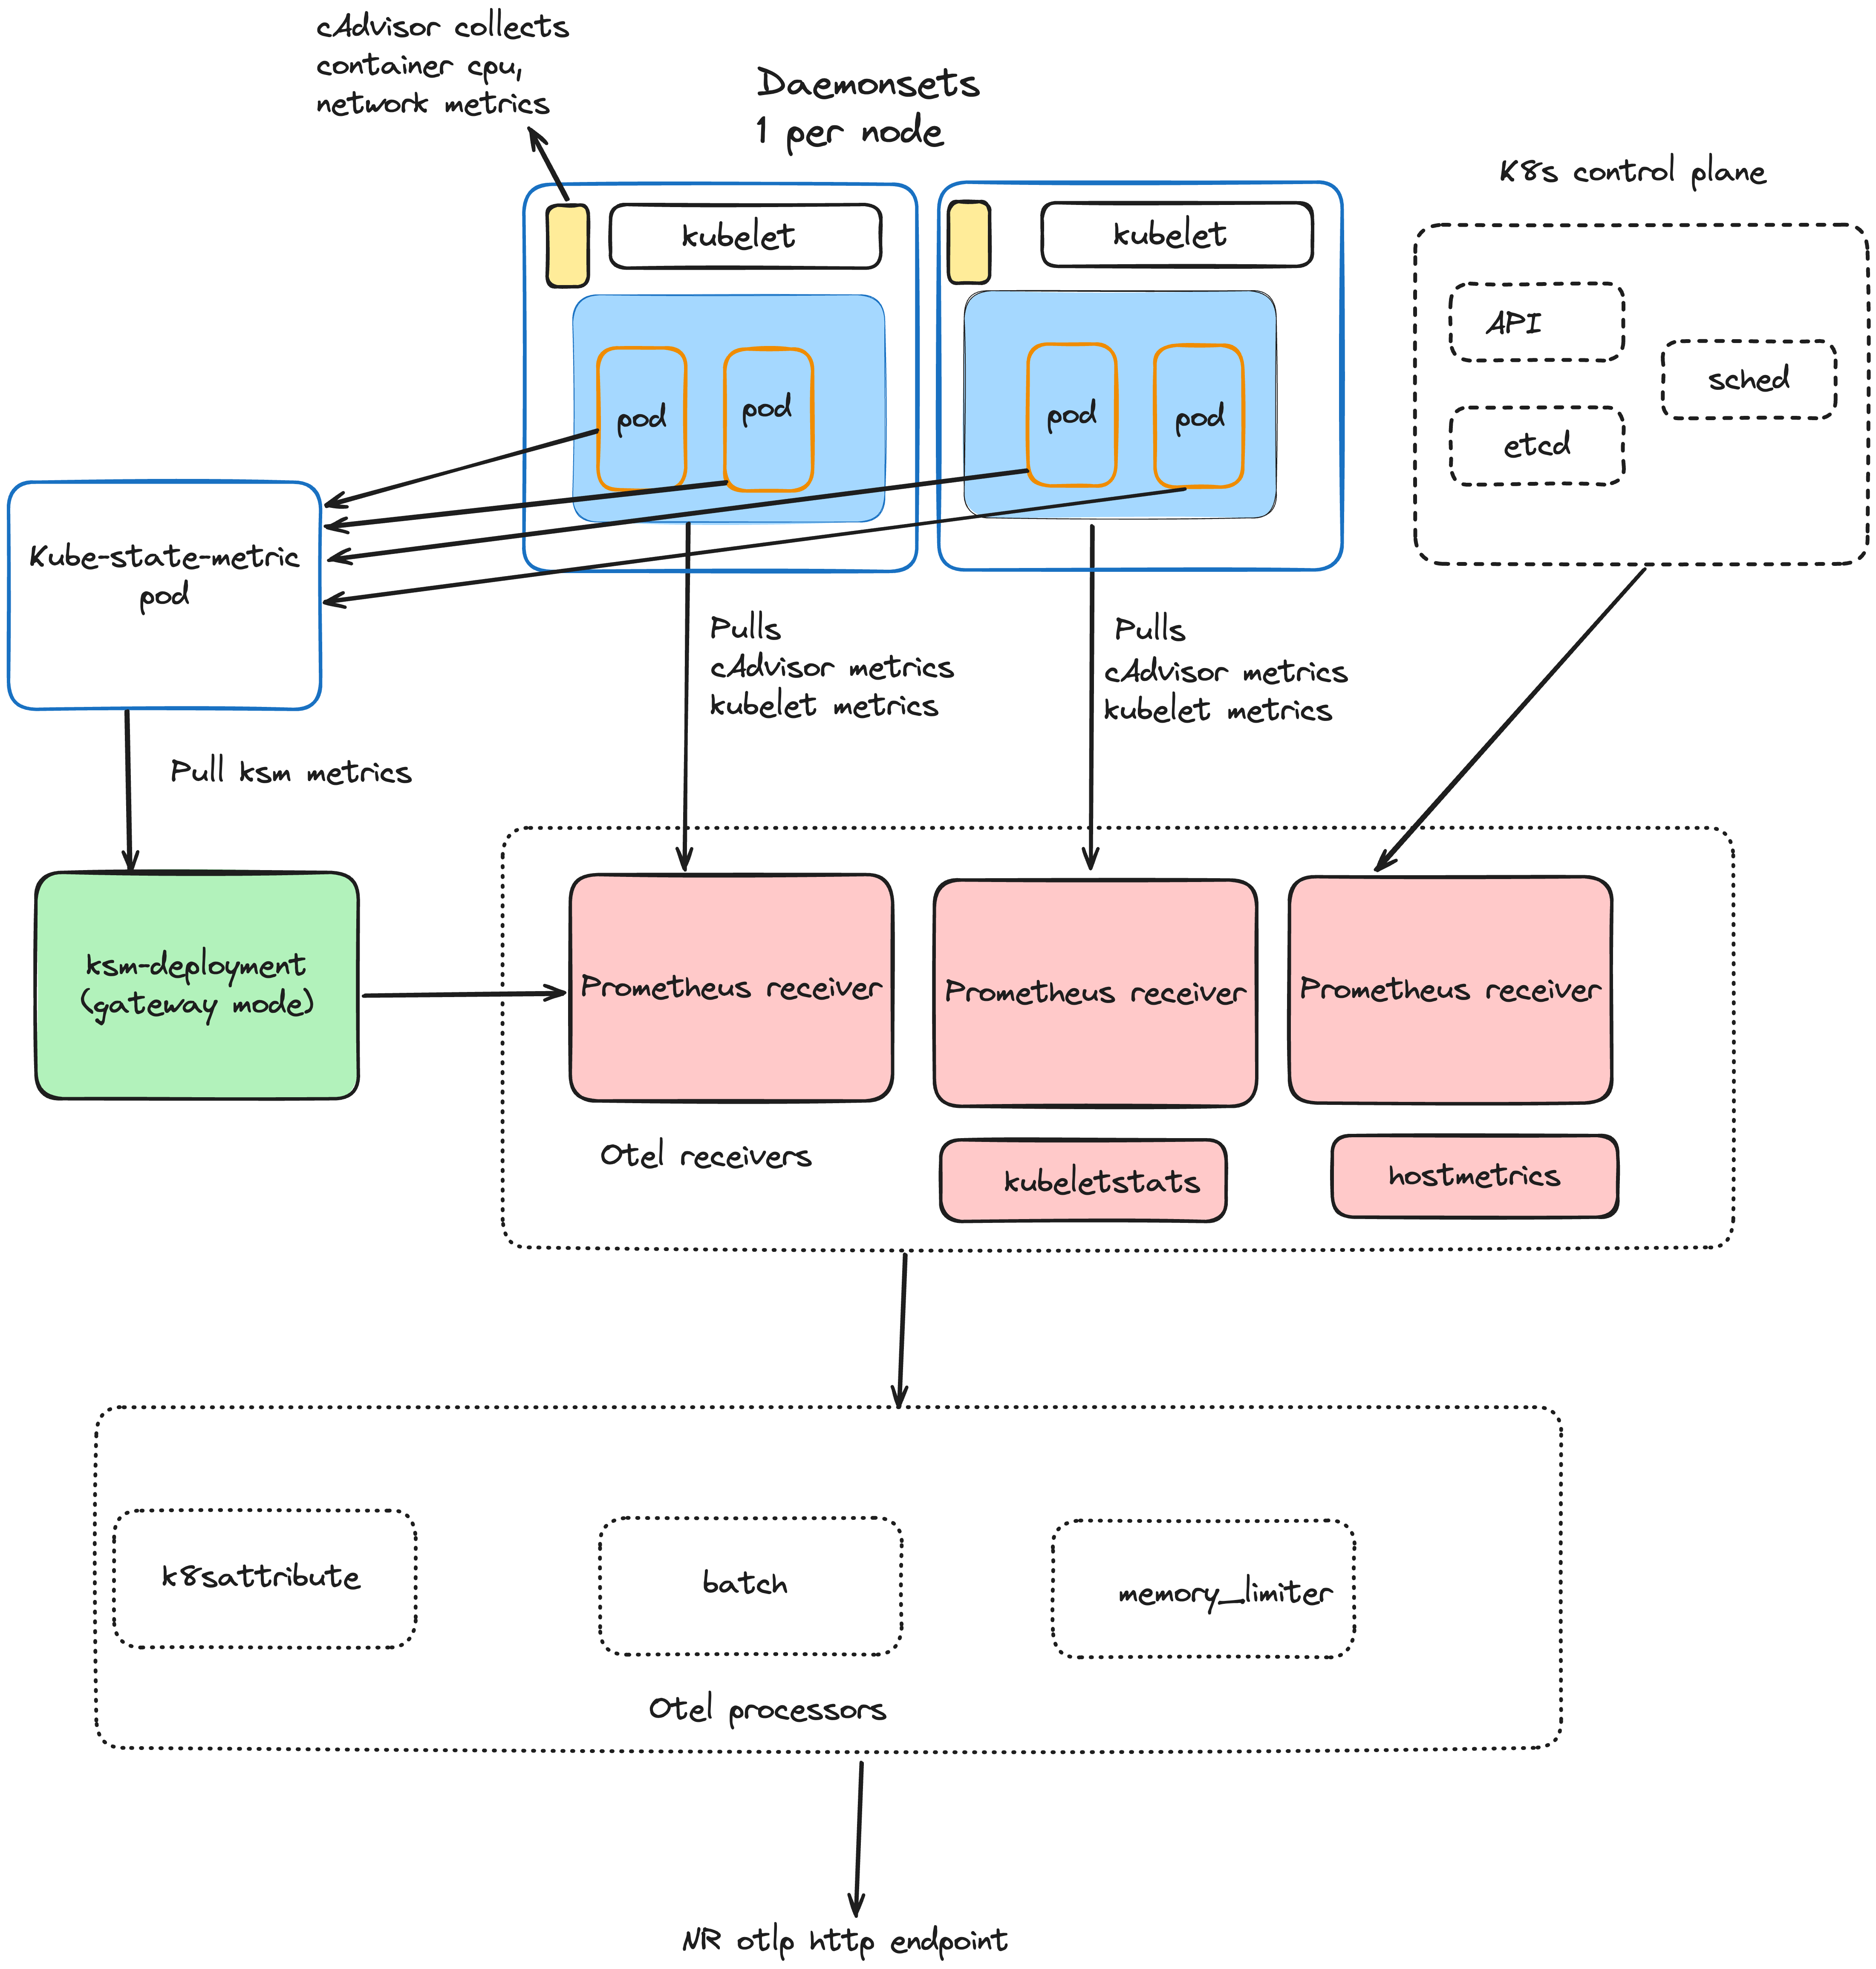
New Relic's OpenTelemetry observability for Kubernetes provides a comprehensive, open-source solution for monitoring your clusters. It integrates seamlessly with our robust Kubernetes UI, which is compatible with both OpenTelemetry and our proprietary Kubernetes instrumentation. This provider-agnostic design allows you to choose the instrumentation method that best suits your needs.
This document guides you through monitoring a Kubernetes cluster using OpenTelemetry. It details how to install the nr-k8s-otel-collector Helm chart within your cluster and deploy the necessary collectors to enable comprehensive observability.
By integrating Kubernetes components into the OpenTelemetry Collector, we can transmit metrics, events, and logs directly to New Relic. These telemetry signals automatically enhance our out-of-the-box experiences such as the Kubernetes Navigator, overview dashboard, Kubernetes events, or Kubernetes APM summary page.
How it works?
The nr-k8s-otel-collector Helm chart deploys OpenTelemetry Collectors configured to gather comprehensive telemetry data from your Kubernetes cluster.

- Daemonset Collector: Deployed on each worker node. It collects metrics from the underlying host,
cAdvisor, andKubelet, and gathers logs from containers. - Deployment Collector: Deployed on the control plane node. It collects metrics from
kube-state-metricsand Kubernetes cluster events. This collector is often a single instance managing cluster-wide data.
OpenTelemetry components in New Relic Kubernetes collectors
The OpenTelemetry Collector employs various component types to process and transform the collected telemetry data. These components are essential for enriching, filtering, and formatting the data before it is sent to New Relic. You can use these components to add your own custom configurations by creating OpenTelemetry Pipelines using extra_config section in the Helm chart.
Component type | Component name | Purpose | Collector |
|---|---|---|---|
Receivers |
| Gathers telemetry transmitted over HTTP. | |
| Scrapes metrics relevant to Kubernetes resource states, such as deployments, pods, and nodes. | ||
| Monitors control plane components. | ||
| Scrapes events like pod creations and deletions, scaling activities, and failure events. | ||
| Scrapes metrics from the underlying node. | ||
| Scrapes metrics from Kubelet. | ||
| Scrapes metrics from cAdvisor. | ||
| Gathers logs from containers. | ||
Processors |
| Batches and optimizes telemetry data flow. | |
| Groups metrics, span and logs. | ||
| Modifies telemetry to customize ingest. | ||
| Optimizes ingest by removing not relevant telemetry. | ||
| Applies changes on resource attributes. | ||
| Detects resource information. | ||
| Enriches telemetry data with K8s attributes. | ||
| Enriches telemetry with attributes. | ||
| Transforms cumulative metrics to delta. | ||
| Manages memory consumption. | ||
| Batches and optimizes telemetry data flow. | ||
Exporters |
| Sends telemetry data using the OpenTelemetry Protocol to New Relic. | |
Pipelines |
| Manages ingest, process, and export of metrics data. | |
Connectors |
| Enriches telemetry data with Kubernetes metadata. |
Related articles
Install OpenTelemetry Collector for Kubernetes
Instrument your Kubernetes Cluster in New Relic using OpenTelemetry Collectors.
Advanced configuration for OpenTelemetry Kubernetes
Customize your OpenTelemetry Collector configuration for Kubernetes in New Relic.
Troubleshooting OpenTelemetry for Kubernetes
Learn how to troubleshoot issues with the OpenTelemetry Collector in Kubernetes.