The integration of APM and infrastructure data allows you to see the health of your entire system from a single page. On the APM Summary page you can monitor hosts, apps, events, and activity and use embedded change tracking to compare your data with any recent deployments. From one page you can respond to an alert, identify a root cause, and quickly resolve any impacts to host performance.
First, this doc will walk you through the process of resolving infrastructure issues with APM. Then it will dig deeper into some of the key features of APM and infrastructure monitoring.
Integrate APM and infrastructure data
For and infrastructure data to be integrated, all of the following must be true:
The APM agent and the infrastructure agent must be installed on the same host.
Both agents must use the same or use license keys from accounts in the same organization.
- A user viewing the APM Summary page must have access to both accounts if separate license keys are used for APM and infrastructure agents.
They must use the same hostname.
For Kubernetes hosted applications, additional integration steps to link APM-instrumented applications to Kubernetes are also required.
If the integration is not working, see Troubleshooting the APM-infrastructure integration.
Respond to an alert
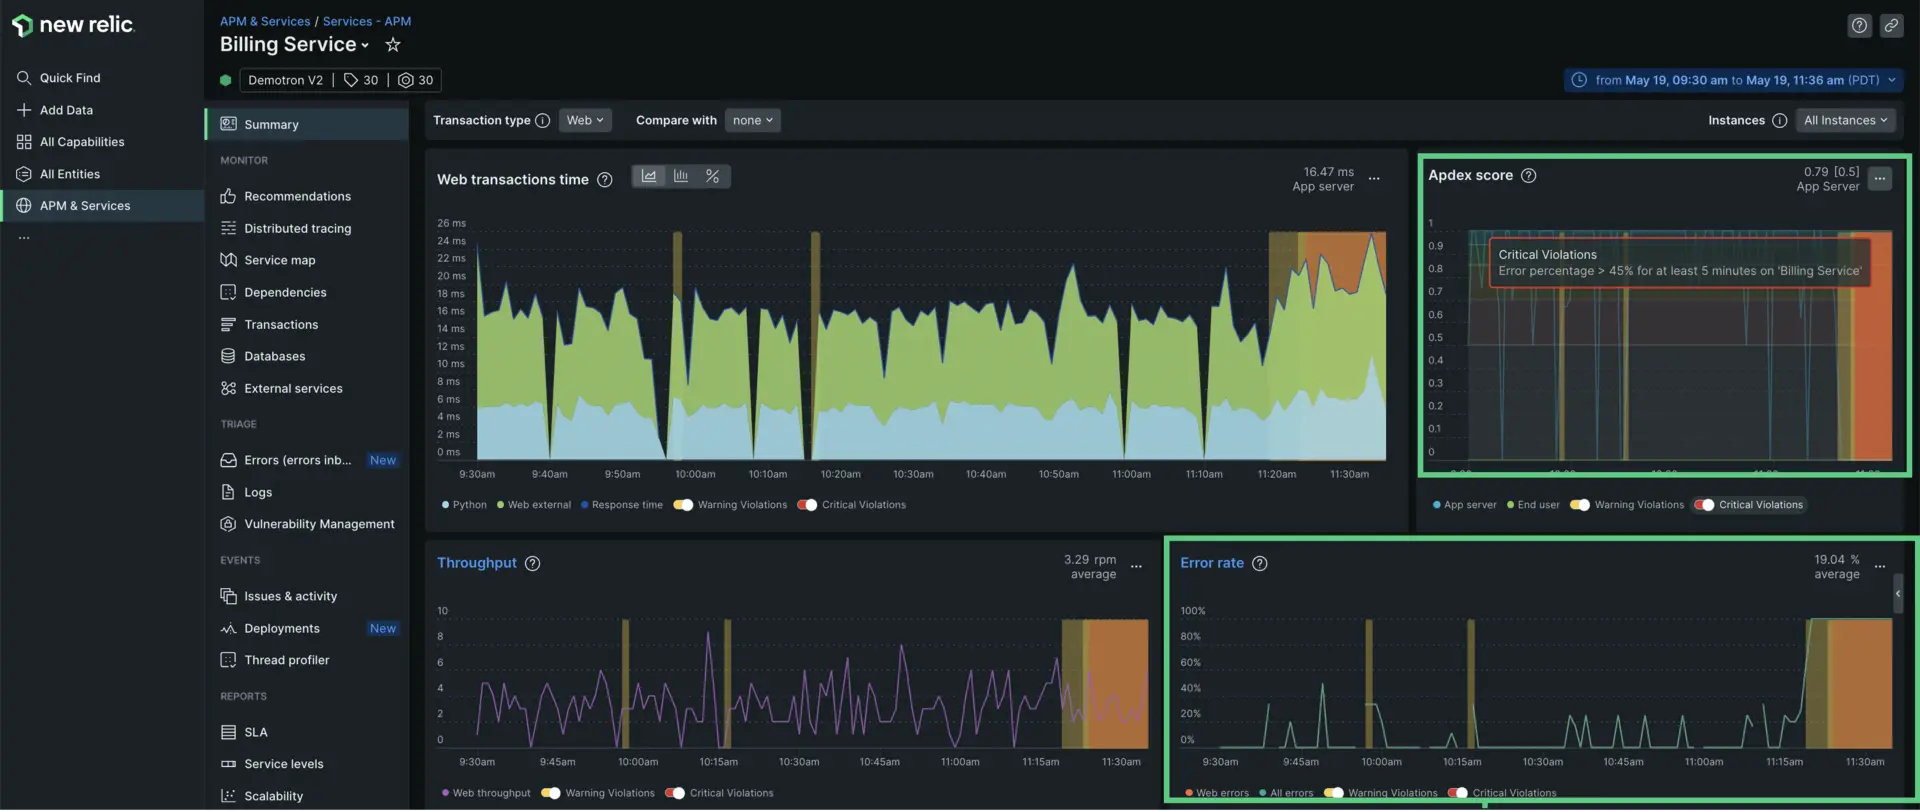
In this example, let's say that you're the engineer responsible for the Billing Service application and you get an alert that says, "Error percentage > 45% for at least five minutes on Billing Service."
The first thing you're going to do is go to the
Billing Serviceapplication in APM and open the Summary page to get an overview of the health of your system. A high Apdex score, which is a measure of user satisfaction, can indicate that there's a problem in your system. Here you can see that the score is .79 and has triggered a critical alert event.Next you're going to check your error rate. Here you can see that the error rate has hit 100%.
Based on these two indicators, you know you have a problem. Now you just have to figure out where and why.
Determine the source of your errors
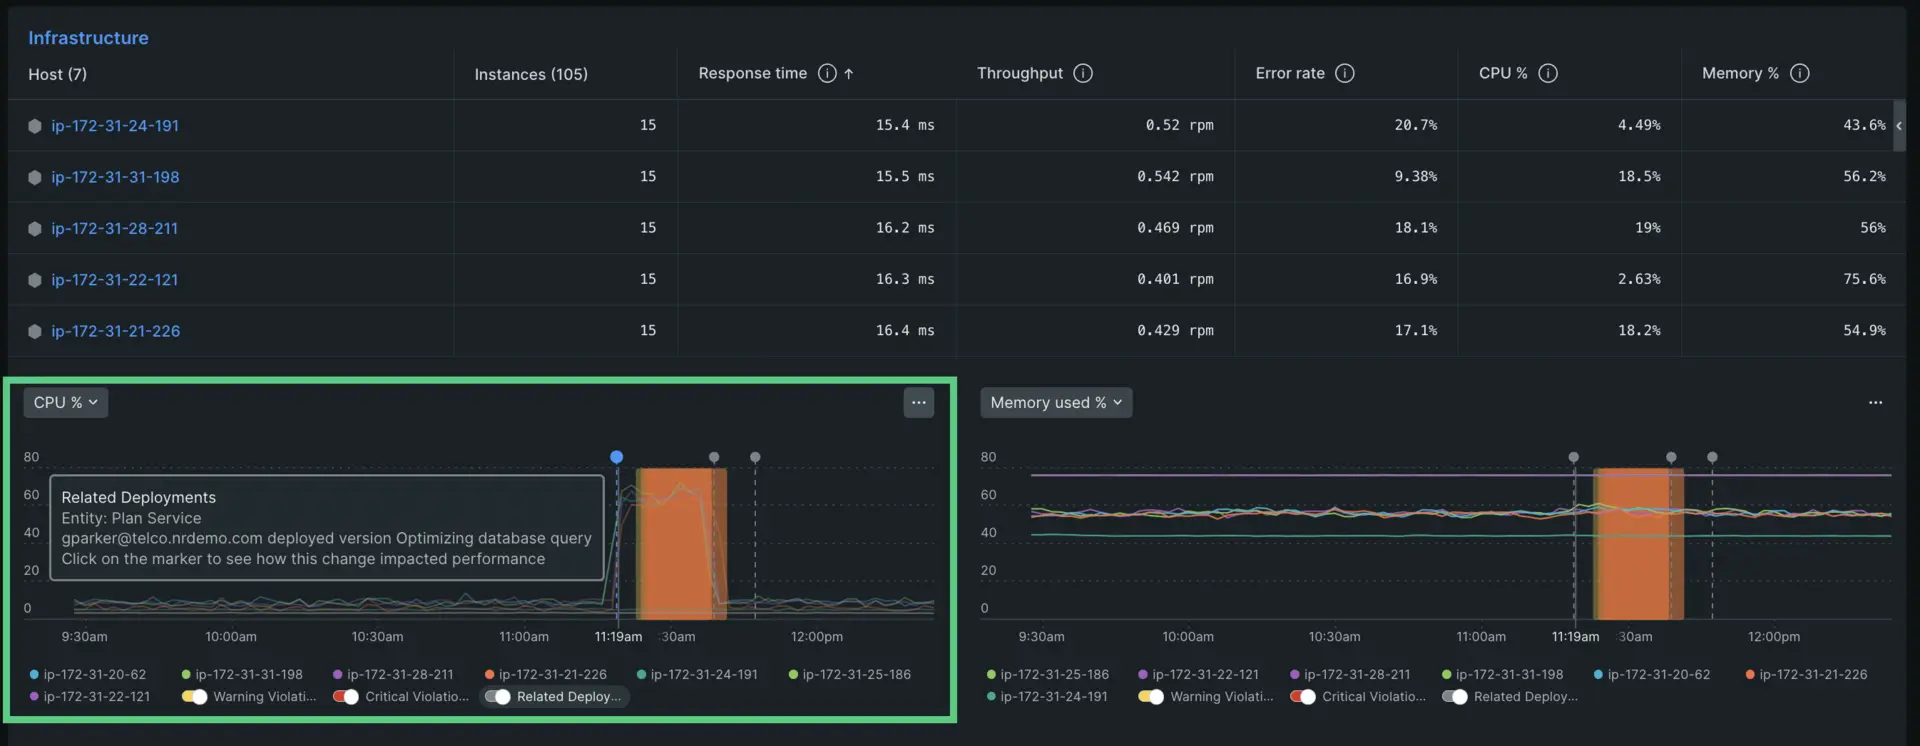
Scroll down to the Infrastructure section of the APM summary page. Here you'll see a table that lists each host connected to the Billing Service application and a record of their Response time, Throughput, Error rate, CPU%. and Memory %. Below the chart are histograms that highlight two of these golden signals. The default selections are CPU % and Memory % but you can also click the dropdown menu in the top left and select a different view.
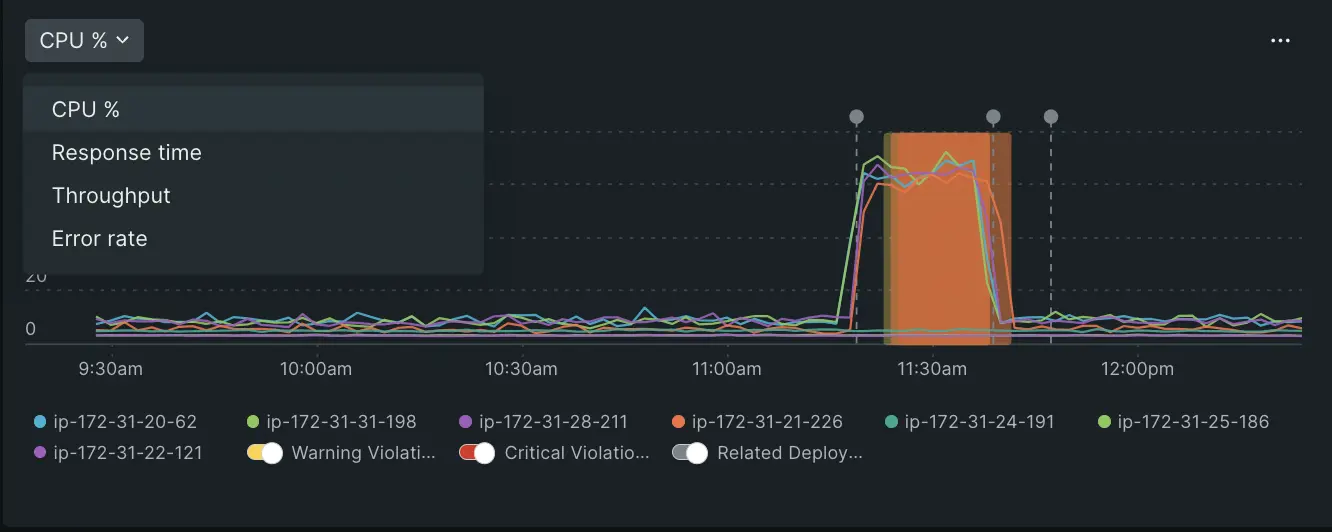
You can toggle between different golden signals you want to inspect.
When you look at the CPU histogram, you can see that the CPU % for all of your hosts skyrocketed around 11:30 am. You can also see that this change in CPU occurred at the same time as a recent deployment. If you click on the deployment marker it will tell you who released a change and what that change entailed.
Dig deep into a specific host
Now that you know that a recent deployment in your Billing Service application caused a spike in errors and critical Apdex alert events you might want to look into a specific host for more clarity. Click the name of the host you want to inspect. It will reveal a sidebar that imports all relevant information from the Infrastructure page. This allows you to access all the information you need regarding your host and any service errors without leaving the rest of your data.
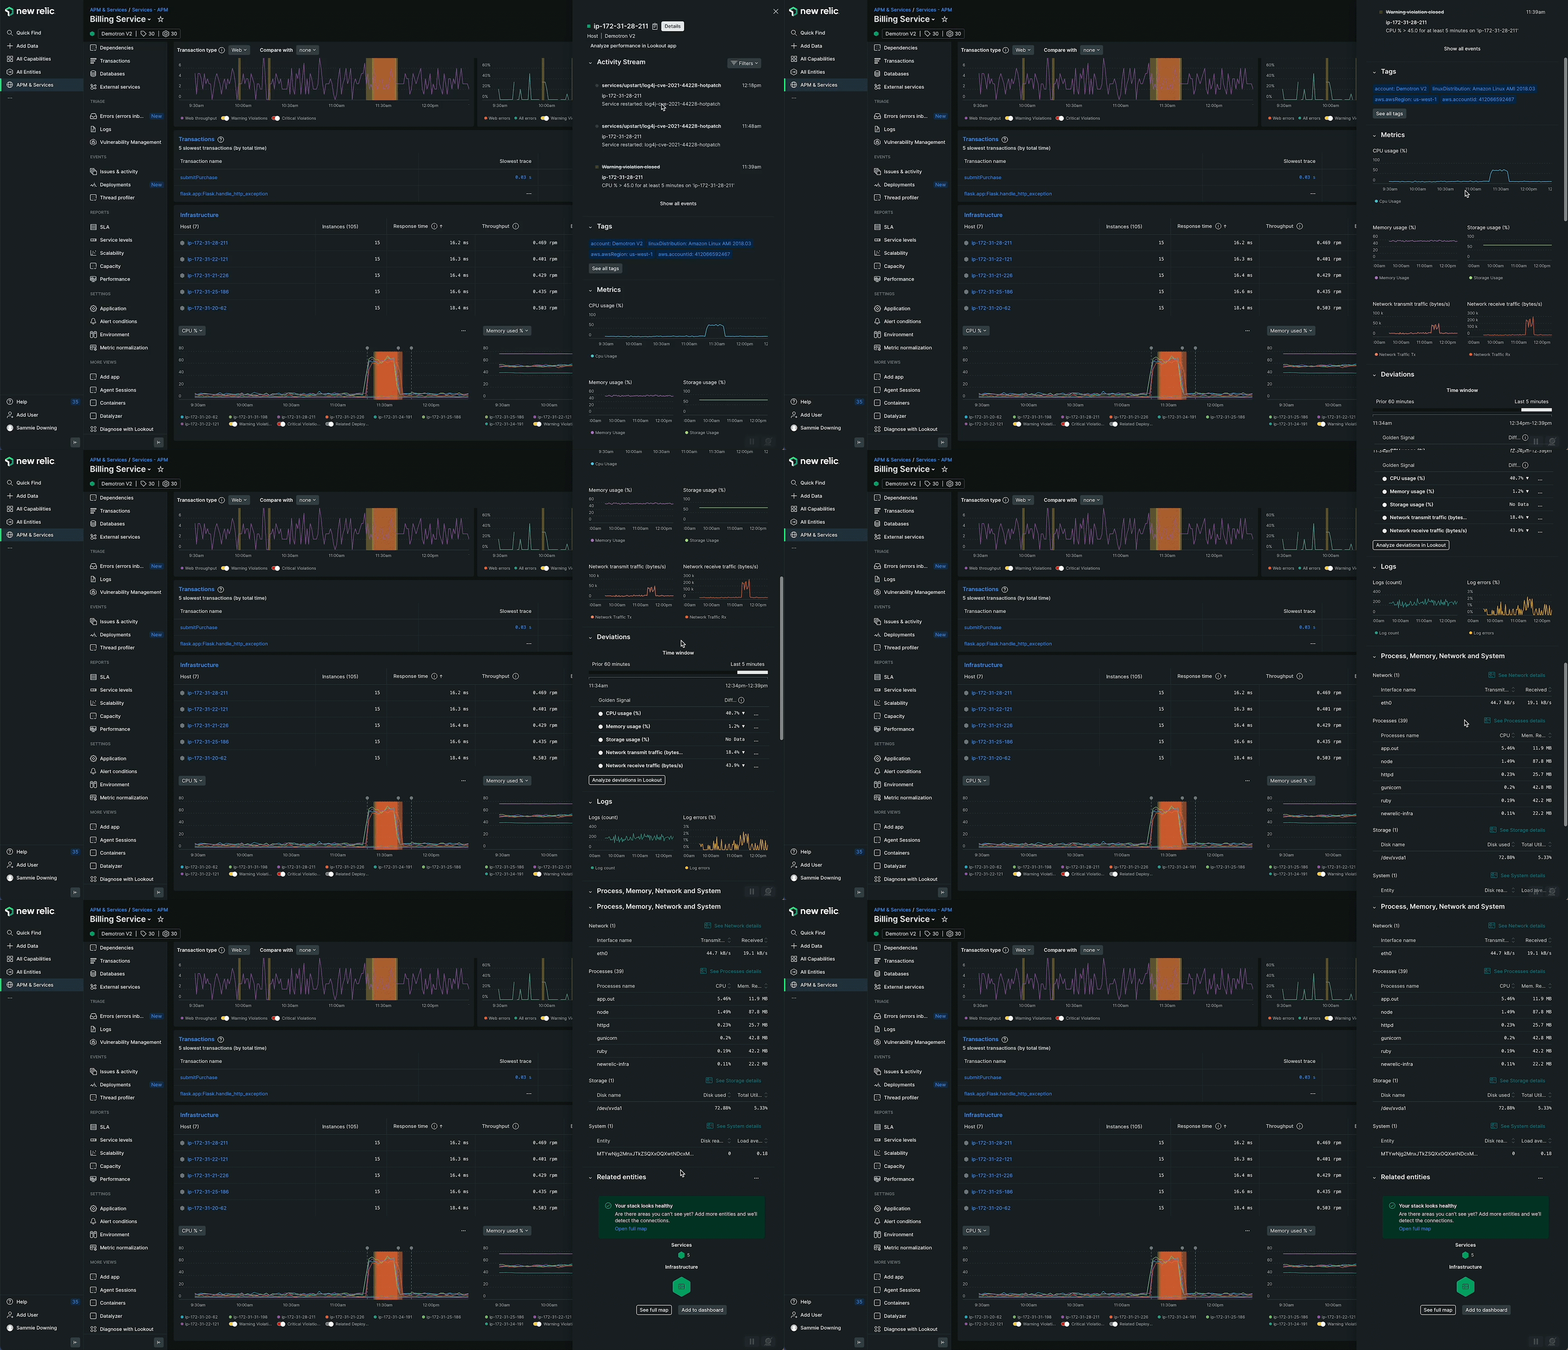
Inspect your host without leaving the APM summary page.
Now that you know how to troubleshoot with APM and infrastructure monitoring we're going to explore how to integrate APM and infrastructure data and put it into practice.
View logs for your APM and infrastructure data
You can also bring your logs and application's data together to make troubleshooting easier and faster. With logs in context, you can see log messages related to your errors and traces directly in your app's UI. You can also see logs in context of your infrastructure data, such as Kubernetes clusters. No need to switch to another UI page.
Filter by application data
When your and infrastructure data is linked, you can filter displayed host data by searching for the specific application you want to inspect. In the case above, you would want to filter for Billing Service.
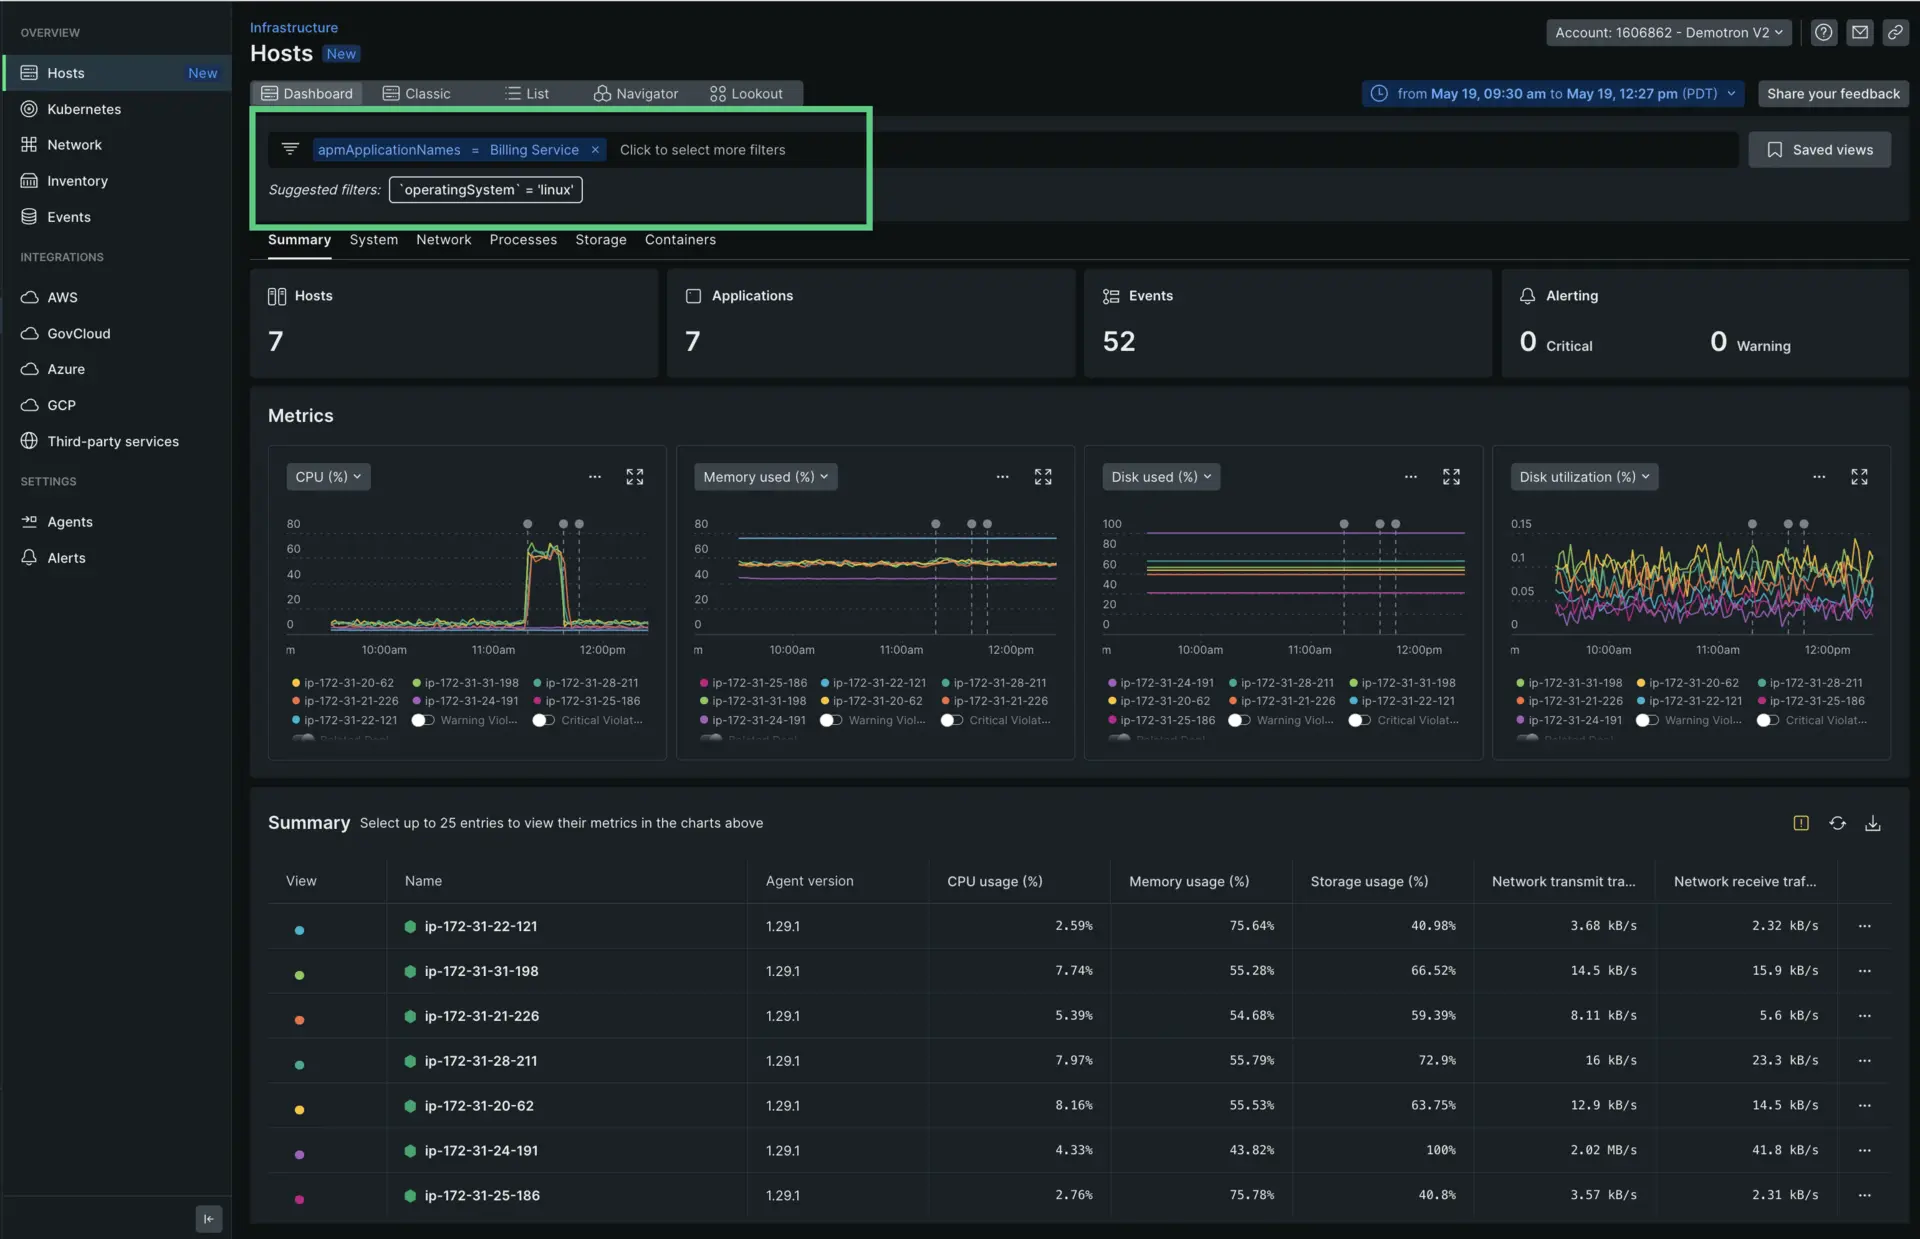
APM data on inventory and events UI pages
When your and infrastructure data is linked, you can view and filter on application data on the infrastructure monitoring UI's Inventory page and the Events page.
Troubleshoot missing APM data
APM/Infrastructure integration should happen automatically if you have both the agent and the infrastructure agent installed on the same host(s) and they use the same or a pair of license keys from the same oganization and have the same hostname set.
If you do not see APM data in infrastructure monitoring, see Troubleshooting.