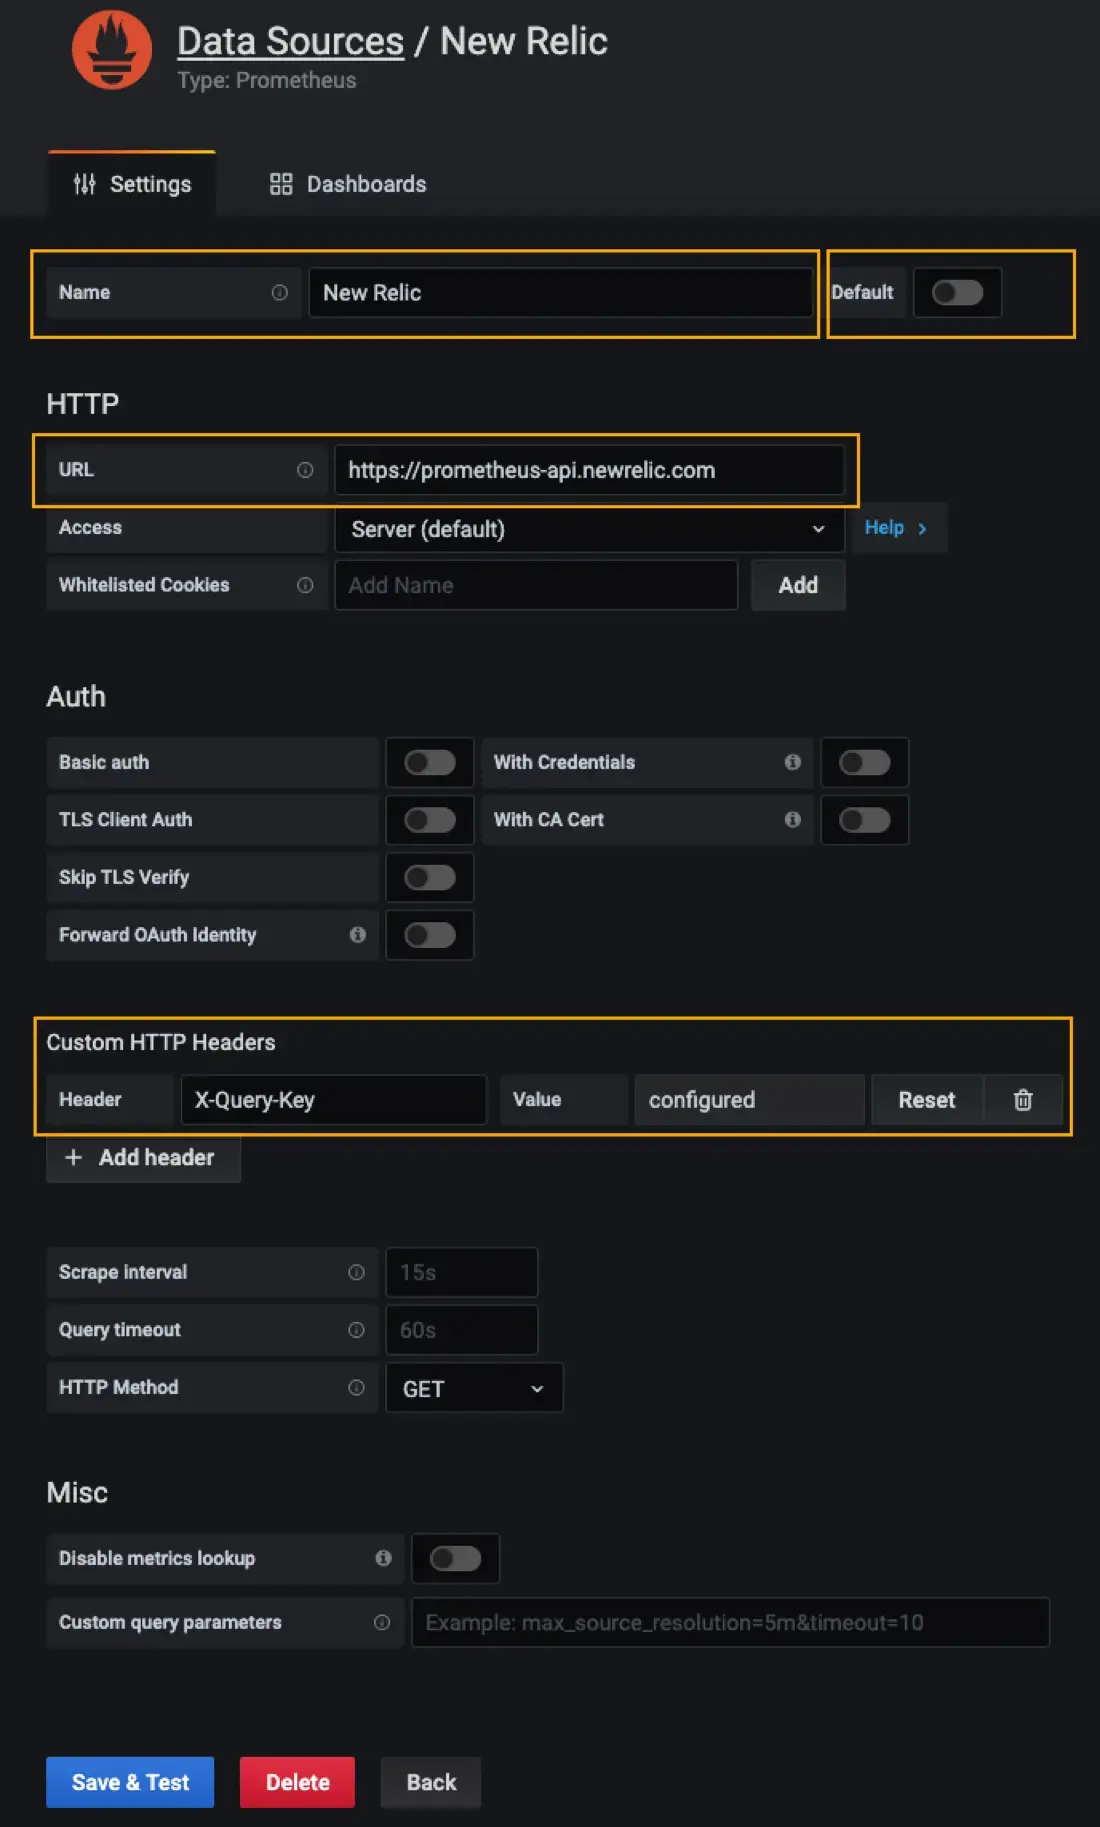
You can configure a Prometheus data source in Grafana to query data stored in the New Relic Database (NRDB) using our PromQL-style query language.
Add a Prometheus data source
Follow these steps to add New Relic as a Prometheus data source for Grafana. These instructions detail how to complete the process when working with Grafana versions 6.7 and higher.
Important
You must complete the Prometheus remote-write integration process prior to beginning the configuration process.
In New Relic, create a new Insights query key.
Important
Note: In Grafana, you'll need put this in a custom X-Query-Key HTTP header (see step 7 below), but it is the same entity as the New Relic Query key.
From the Grafana Home screen, go to Configuration > Data Sources and click Add data source.
From the Add data source screen under Time series databases options, select Prometheus.
Enter the Name you want to use for your new Prometheus data source.
Set the Default toggle to the on or off position, depending on whether you want this to be your default data source for Prometheus queries.
- Off: this is not your default data source
- On: this is your default data source
Enter the correct URL:
Under Custom Headers, select Add Header. Set the Header name to X-Query-Key. For the Value, enter to the Query key you created in step 1.
Click Save & Test.
Tip
If your graphs appear as groupings of dots and not as connected lines, you can change the graph style to display lines instead. To do this, go to Grafana's Graph panel and select Stacking and null value > connected.
Did this doc help with your installation?
Versioning considerations
New Relic strongly recommends using versions 6.7.x and higher to configure New Relic as a Prometheus data source. If you do chose to complete the configuration while running an earlier version, you will need to do one of the following to successfully configure your data source:
- Configure the new data source to use basic authentication and then enter the Query-key as the password in the basic authentication workflow.
- Configure the new data source URL to include the Query-key:
https://prometheus-api.newrelic.com/auth/`<query-key>`
Customize Prometheus API behavior
Headers are particularly important if you have connected multiple Prometheus servers to New Relic using the remote write integration. Here are some details about customization.
Delete a Prometheus data source
To delete a data source in Grafana:
- Go to Configuration > Data Sources.
- Click on the data source you want to delete.
- Click the Delete button at the bottom of the page.
